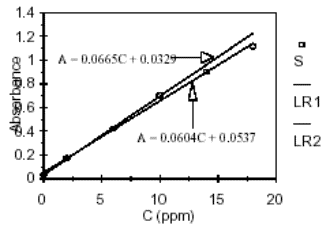
Calibration Curve
Fitting all data to a linear regression line (LR1)
LR line). Second
approximation: the linear dynamic range is 0-10
ppm
.Fitting the first 4 data points to a linear
regression
line (LR2) produces a much better fit of data to the
LR line.
The sensitivity is 0.0665 ppm . To !1
calculate [C?], invert the equation:
A = 0.501 = 0.0665[C?] + 0.0329; [C?] = (0.501 !
0.0329)/0.0665 = 7.04 ppm