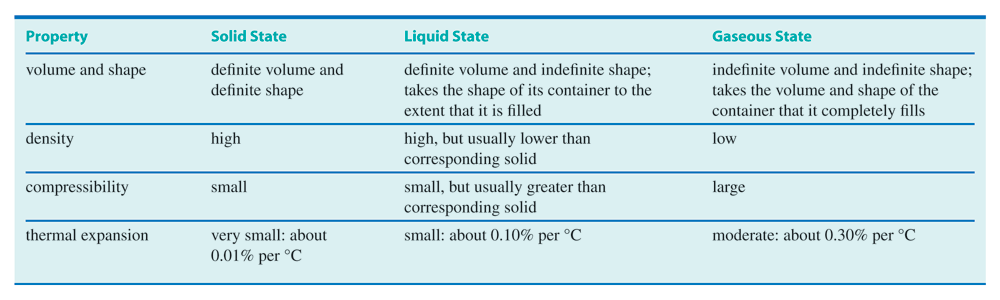
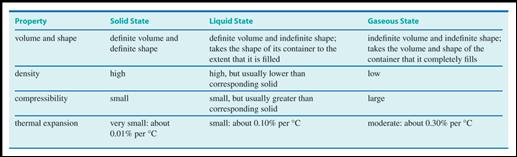
|
1
|
- Gases, Liquids, and Solids
|
|
2
|
|
|
3
|
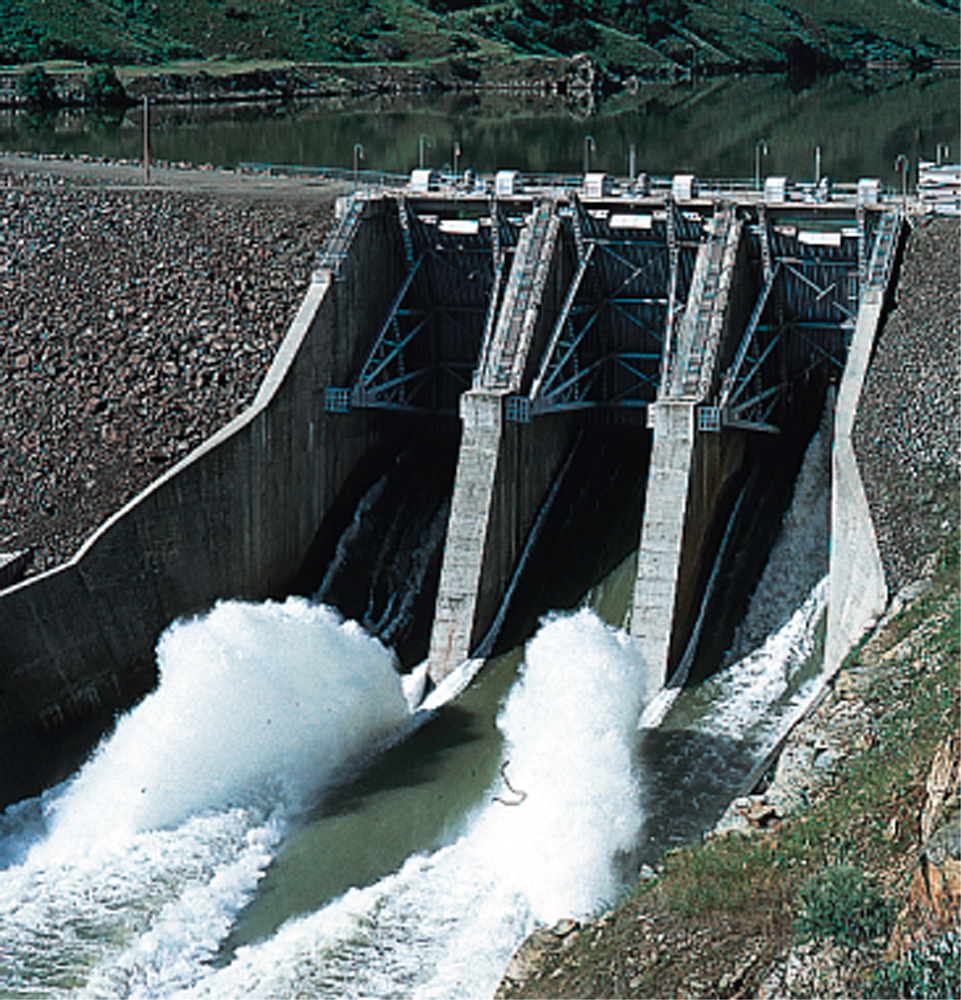
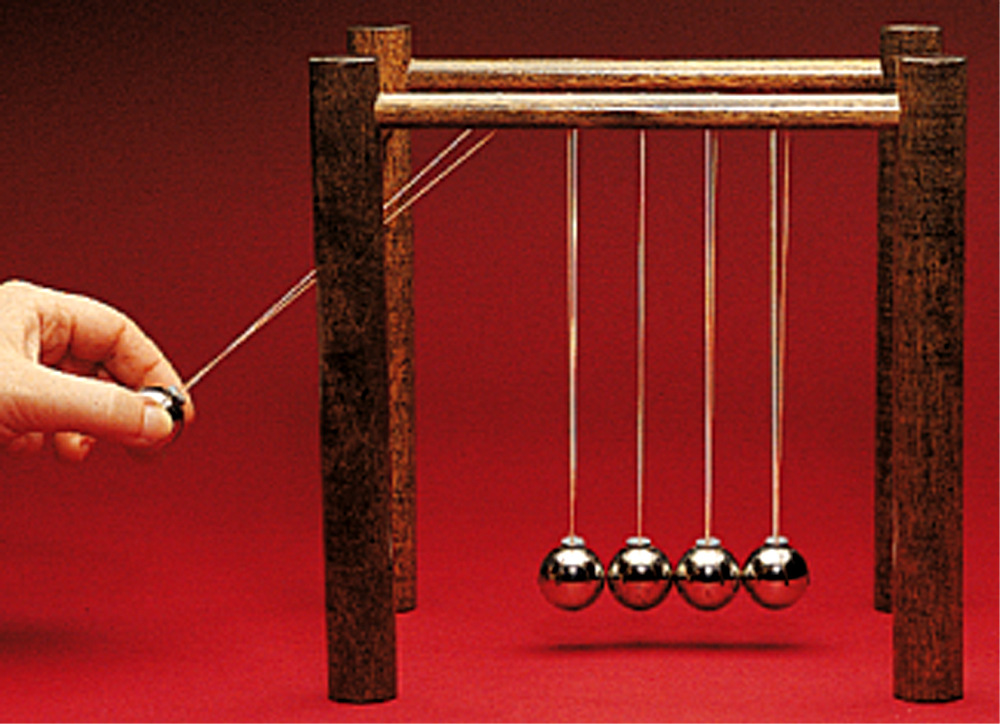
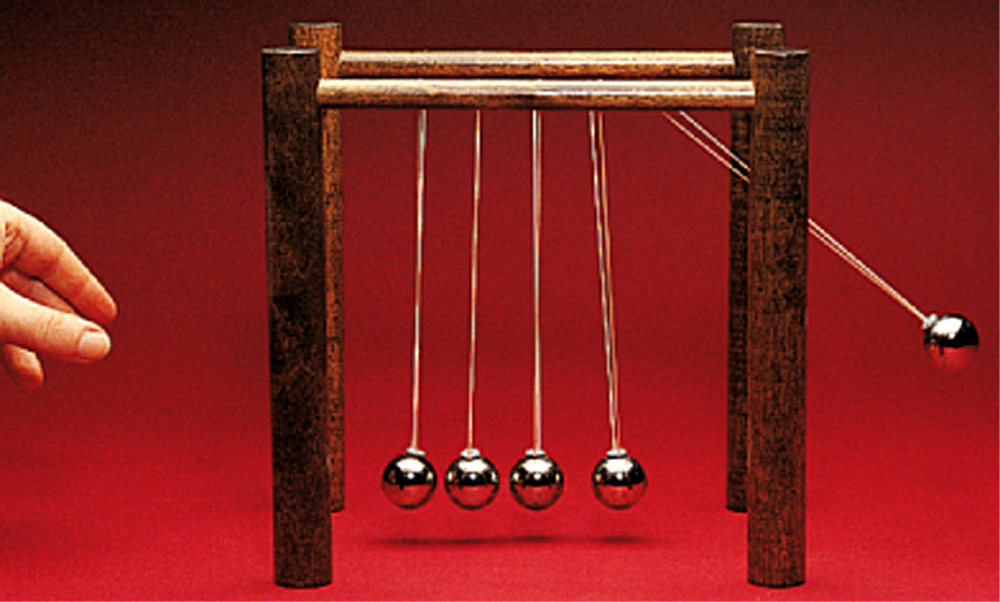
- Fig. 7.1
- The water in the lake behind the dam has potential energy as a result
of its position.
|
|
4
|
|
|
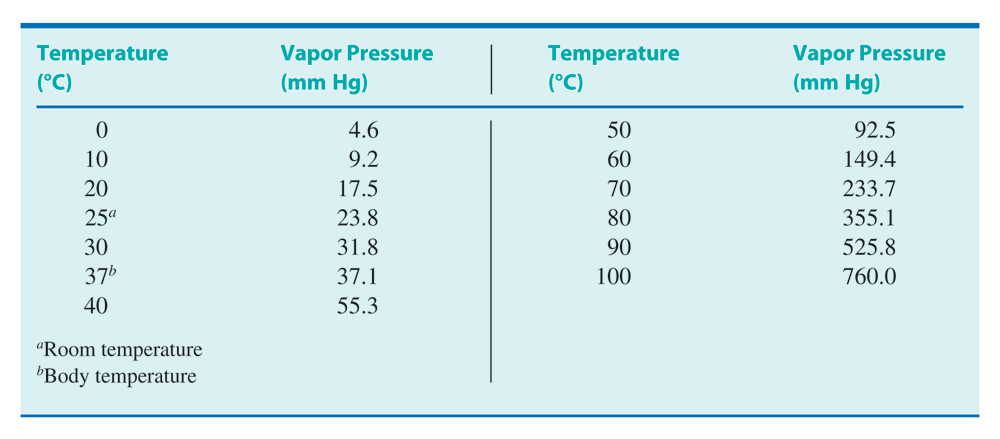
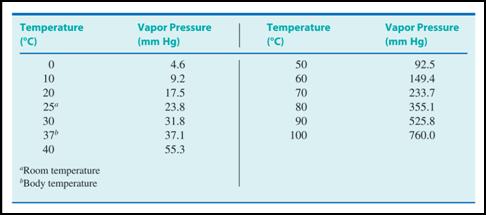
5
|
|
|
6
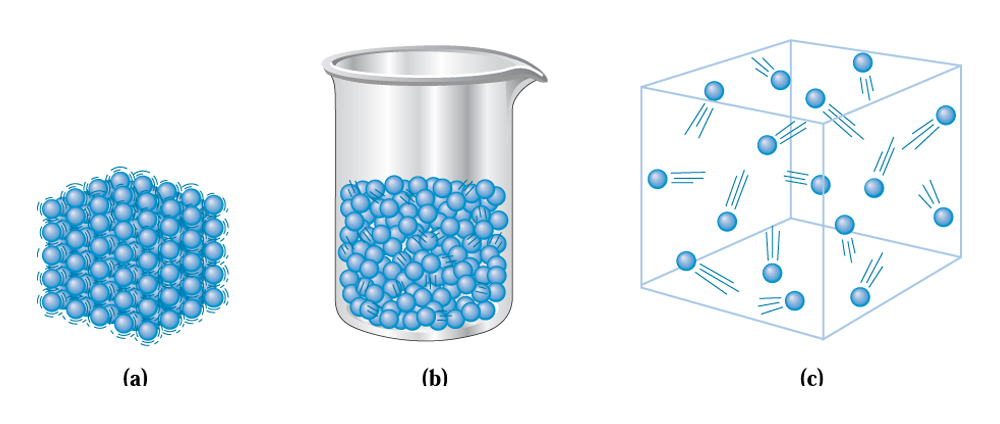
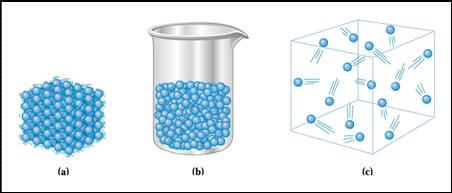
|
- Fig. 7.3
- (a) In a solid, the particles are close together. (b) In a liquid, the
particles slide freely over one another. (c) In a gas, the particles are
in random motion.
|
|
7
|
- Fig. 7.4
- Gas molecules can be compared to billiard balls in random motion,
bouncing off one another.
|
|
8
|
|
|
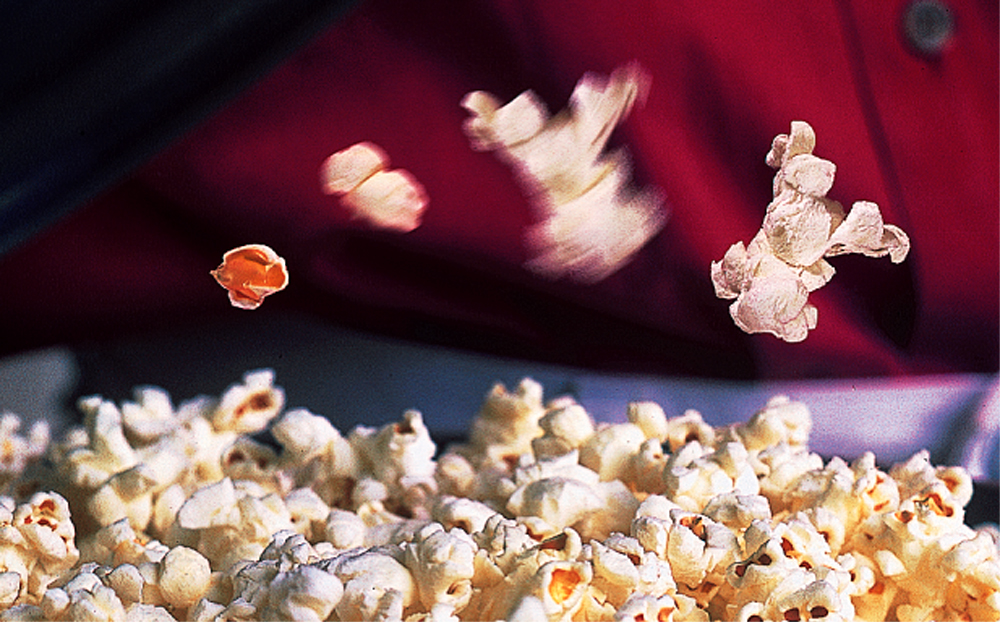
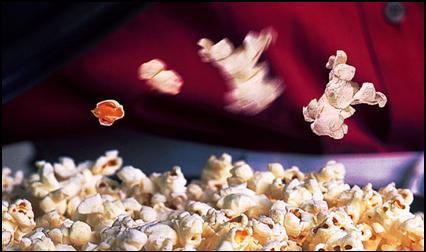
9
|
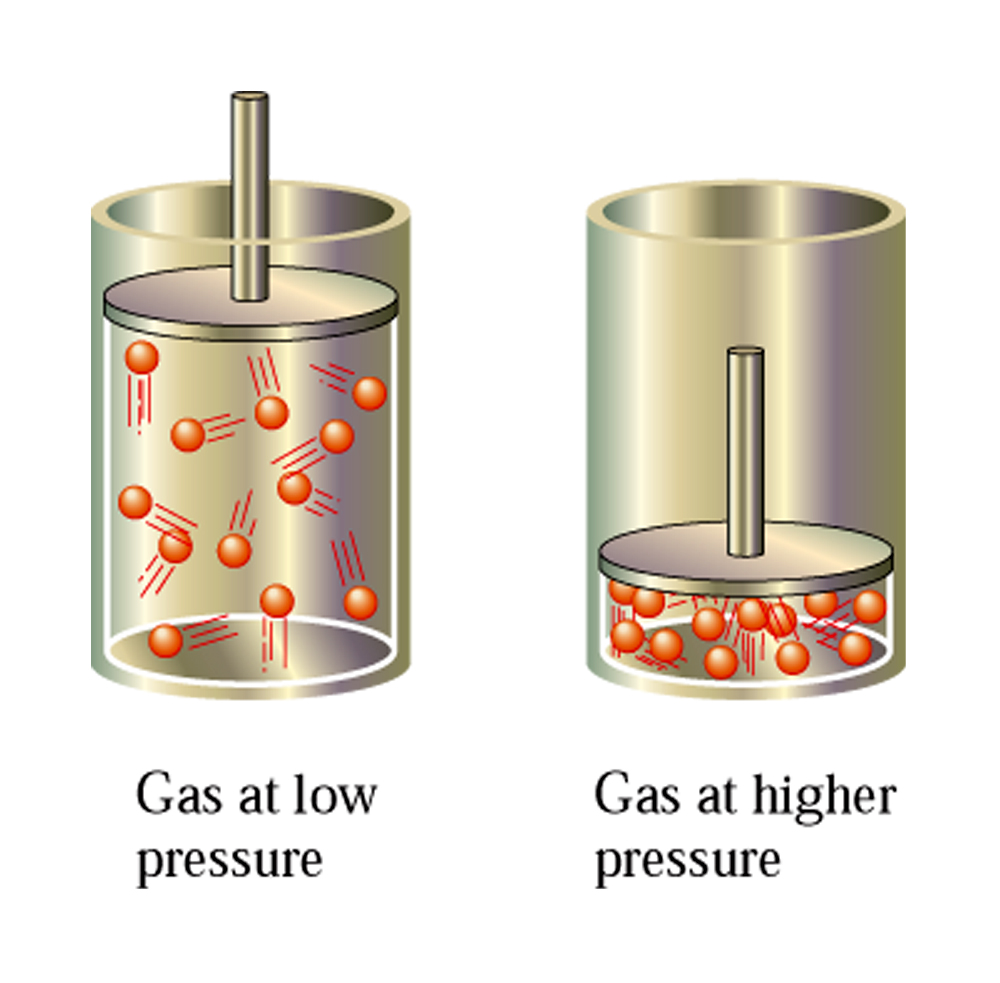
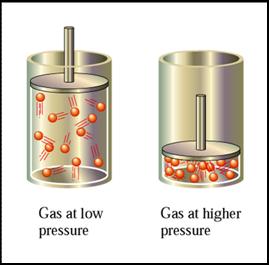
- Fig. 7.5
- When a gas is compressed, the amount of empty space in the container is
decreased.
|
|
10
|
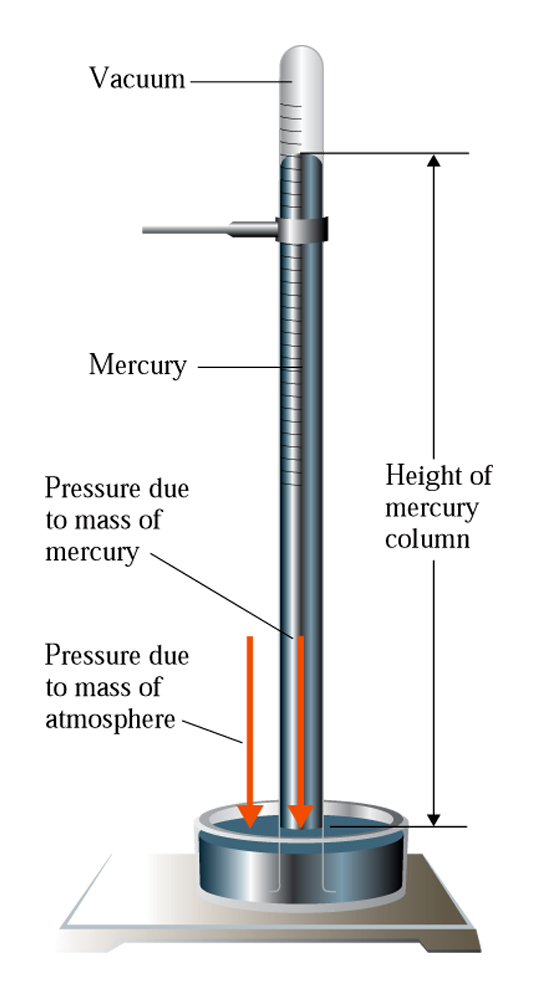
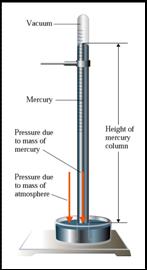
- Fig. 7.6
- The essential components of a mercury barometer are a graduated glass
tube, a glass dish, and liquid mercury.
|
|
11
|
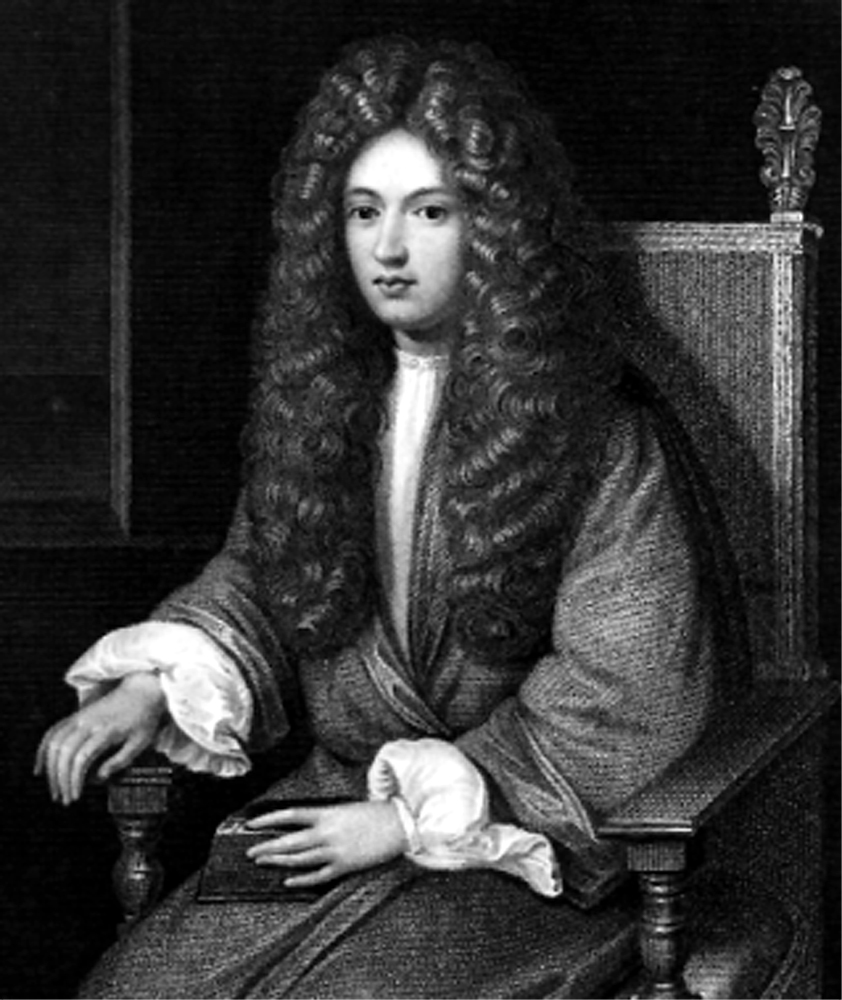
- Fig. 7.7
- Robert Boyle was self-taught. Through his efforts, the true value of
experimental investigation was first recognized.
|
|
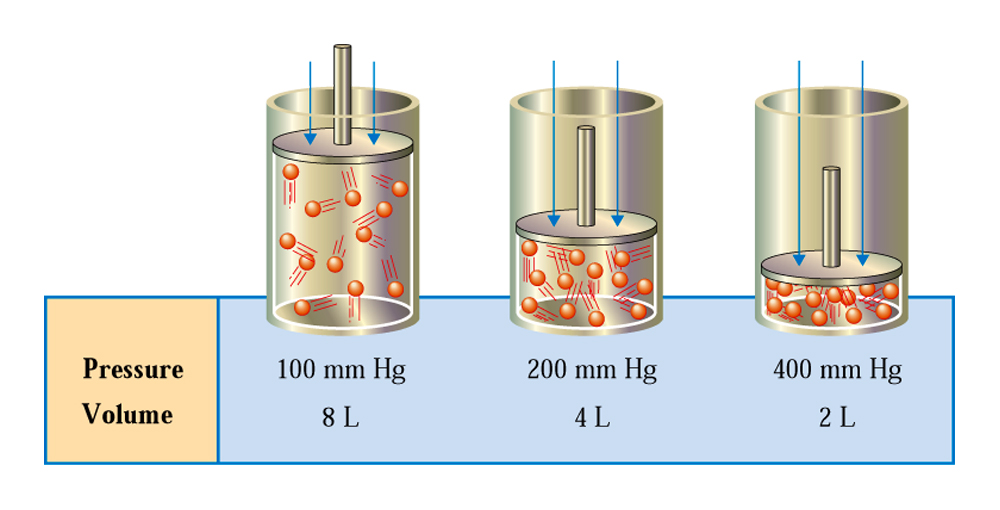
12
|
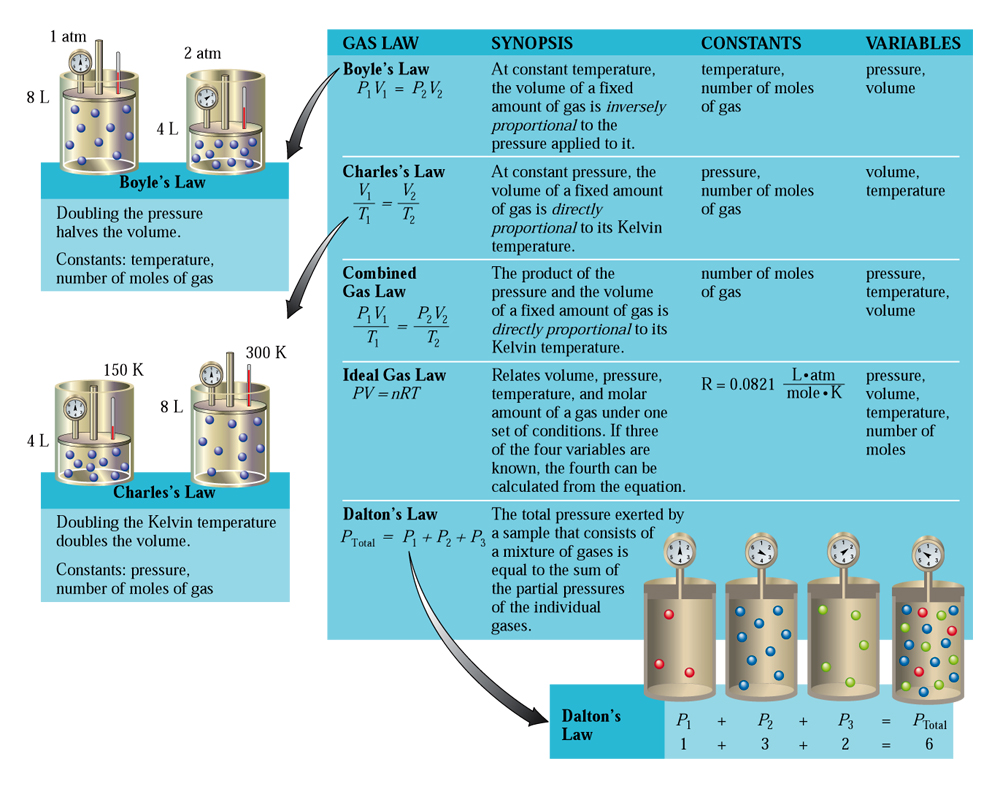
- Fig. 7.8
- Data illustrating the inverse proportionality associated with Boyle’s
law.
|
|
13
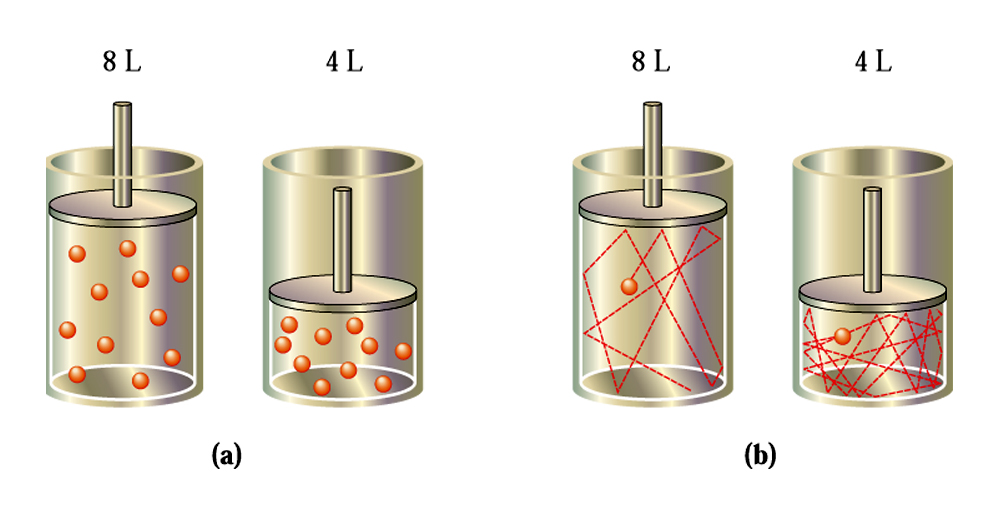
|
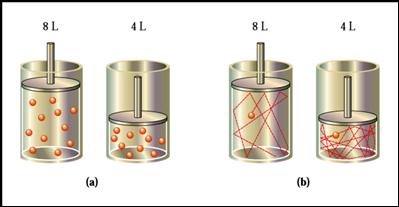
- Fig. 7.9 When the volume of a
gas at constant temperature decreases by half, the average number of
times a molecule hits the container walls is doubled.
|
|
14
|
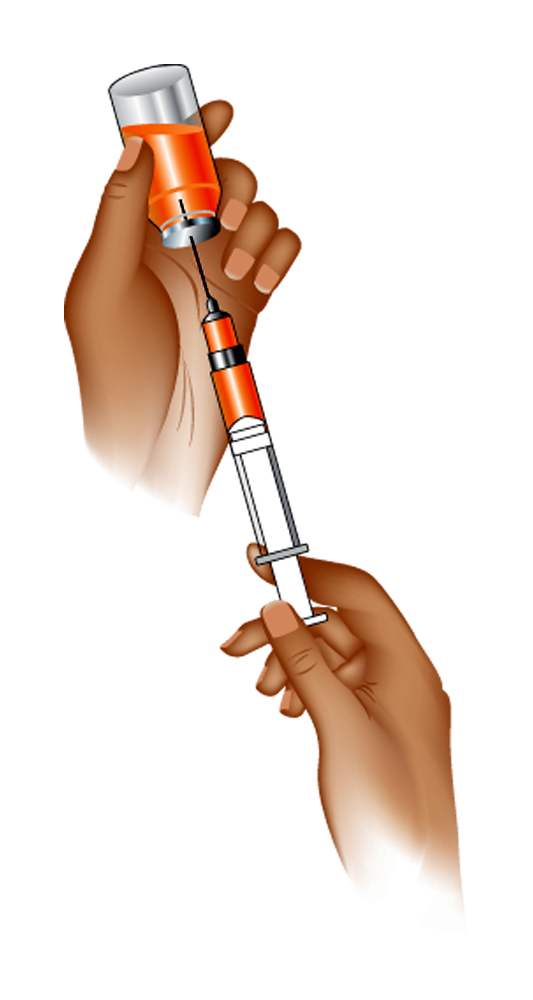
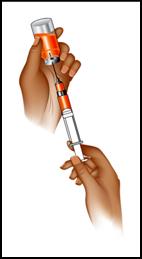
- Fig. 7.10
- Filling a syringe with a liquid is an application of Boyle’s law.
|
|
15
|
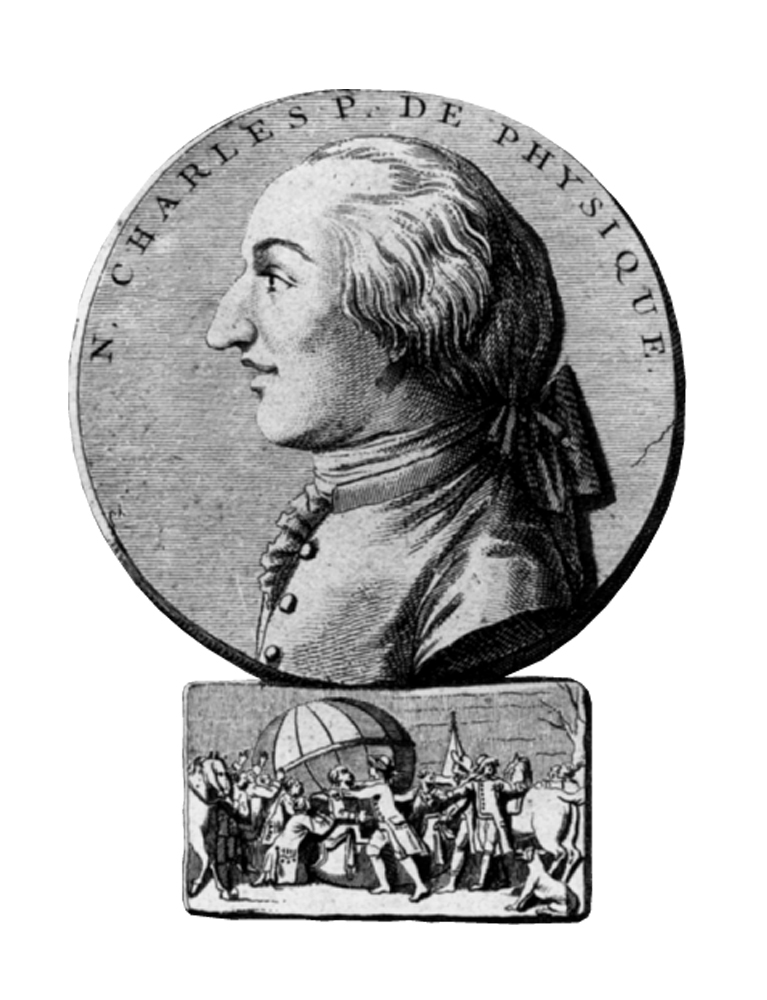
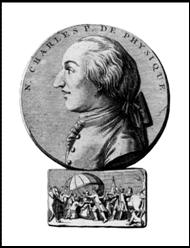
- Fig. 7.11
- Jacques Charles in the process of working with hot-air balloons made
the observations that led to the formulation of what is now known as
Charles’s law.
|
|
16
|
- Fig. 7.12
- Data illustrating the direct proportionality associated with Charles’s
law.
|
|
17
|
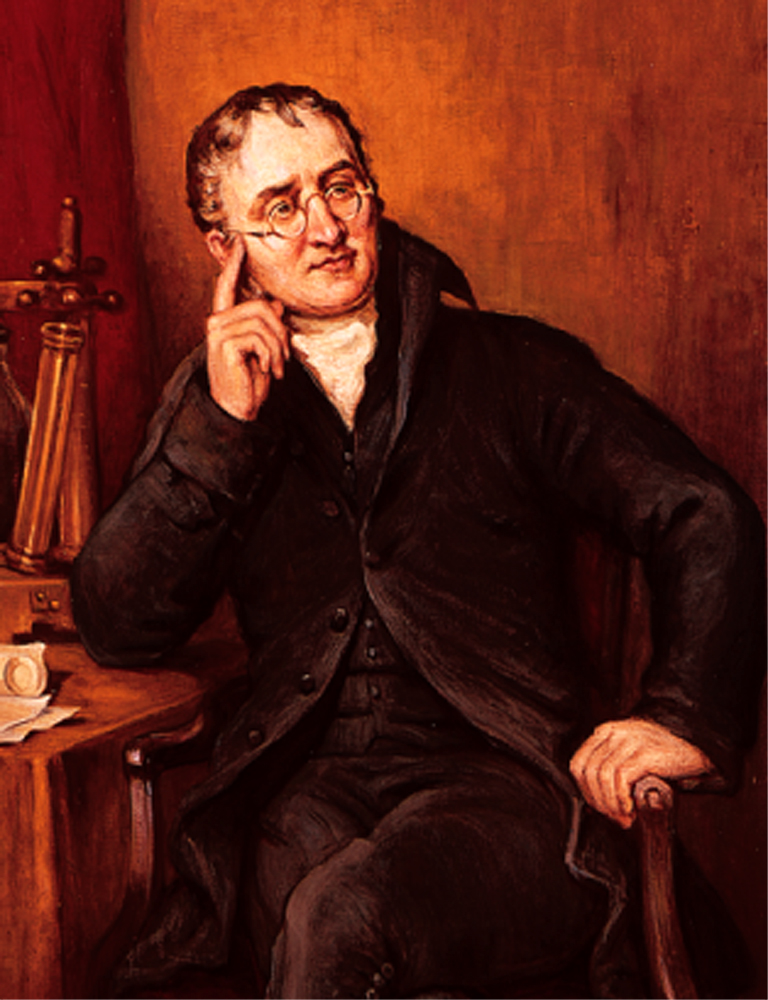
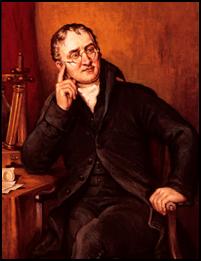
- Fig. 7.13
- John Dalton had an interest in the study of weather.
|
|
18
|
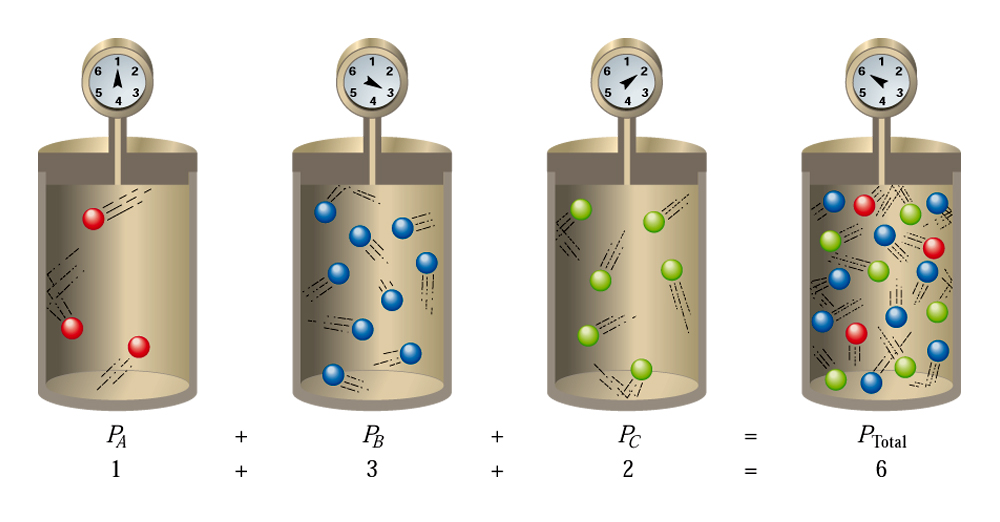
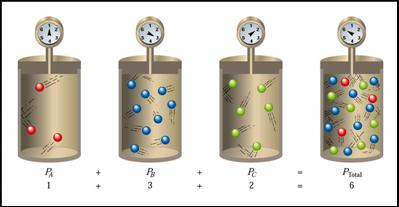
- Fig. 7.14
A set of four containers can be used to illustrate Dalton’s law
of partial pressures. The pressure in the fourth container equals the
sum of the first three.
|
|
19
|
|
|
20
|
|
|
21
|
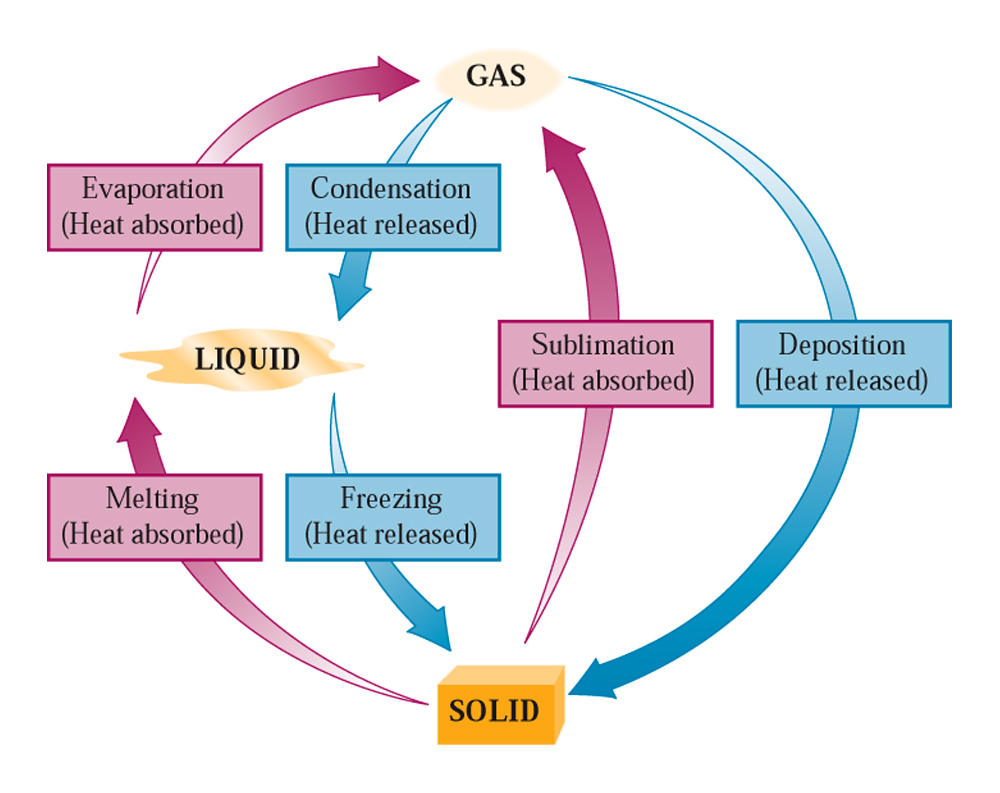
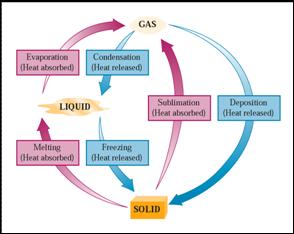
- Fig. 7.15
- There are six changes of state possible for substances.
|
|
22
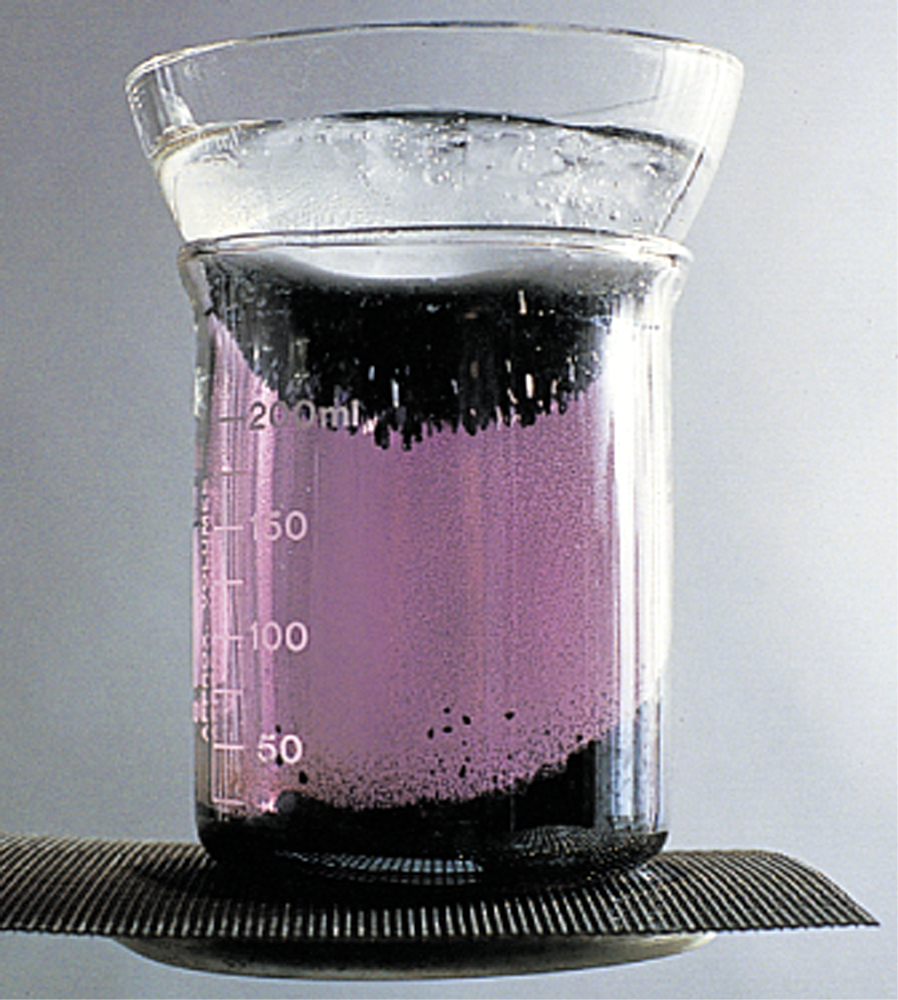
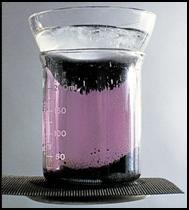
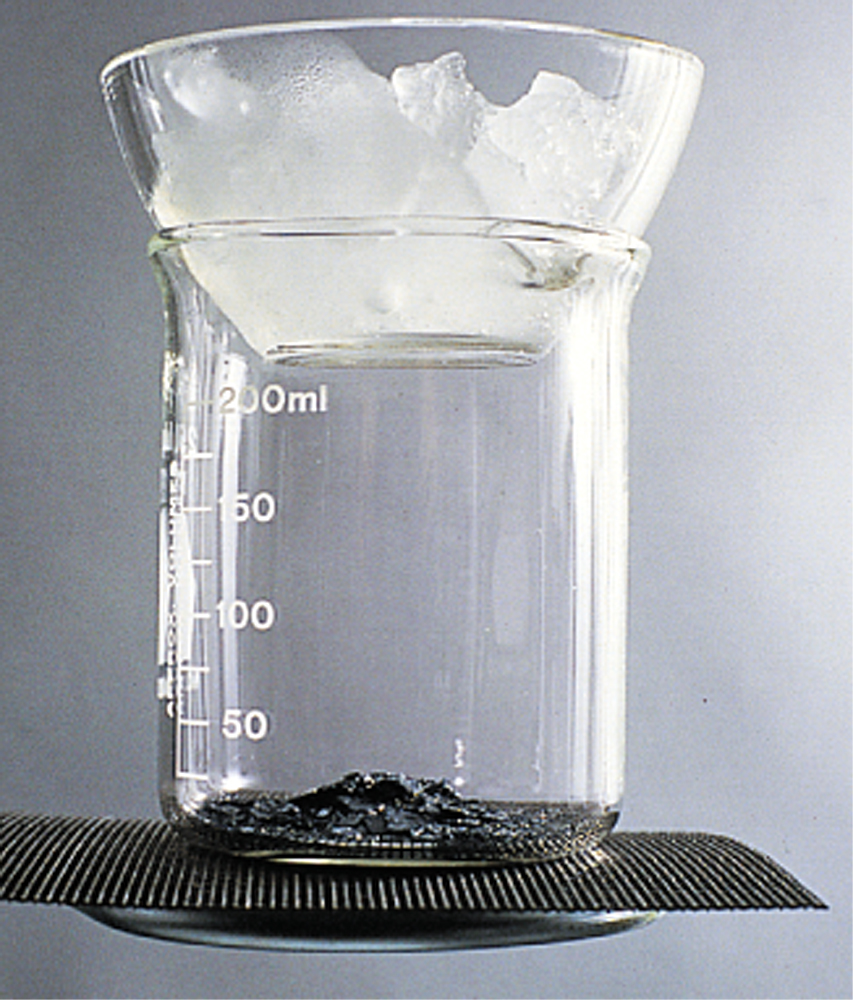
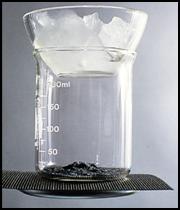
|
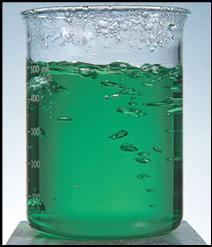
- The beaker contains iodine crystals.
|
|
23
|
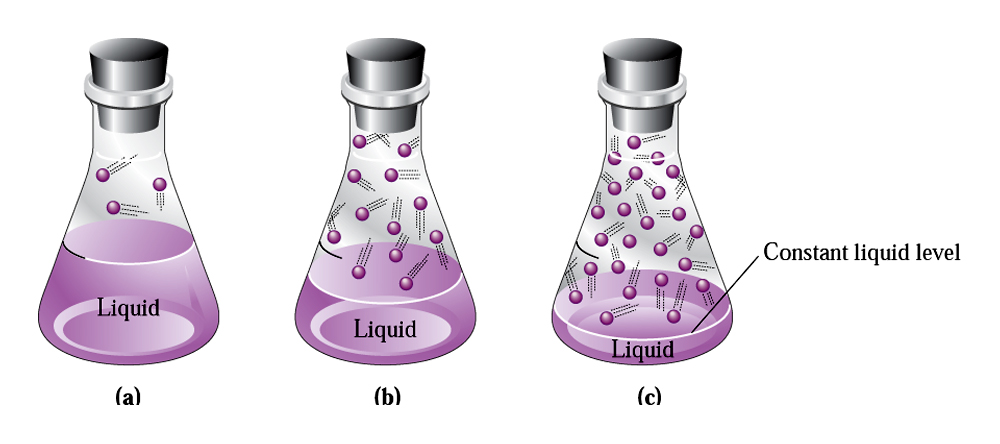
- Fig. 7.17
- (a) the liquid level drops for a time, (b) then becomes constant. At
that point a state of equilibrium has been reached in which (c) the rate
of evaporation equals the rate of condensations.
|
|
24
|
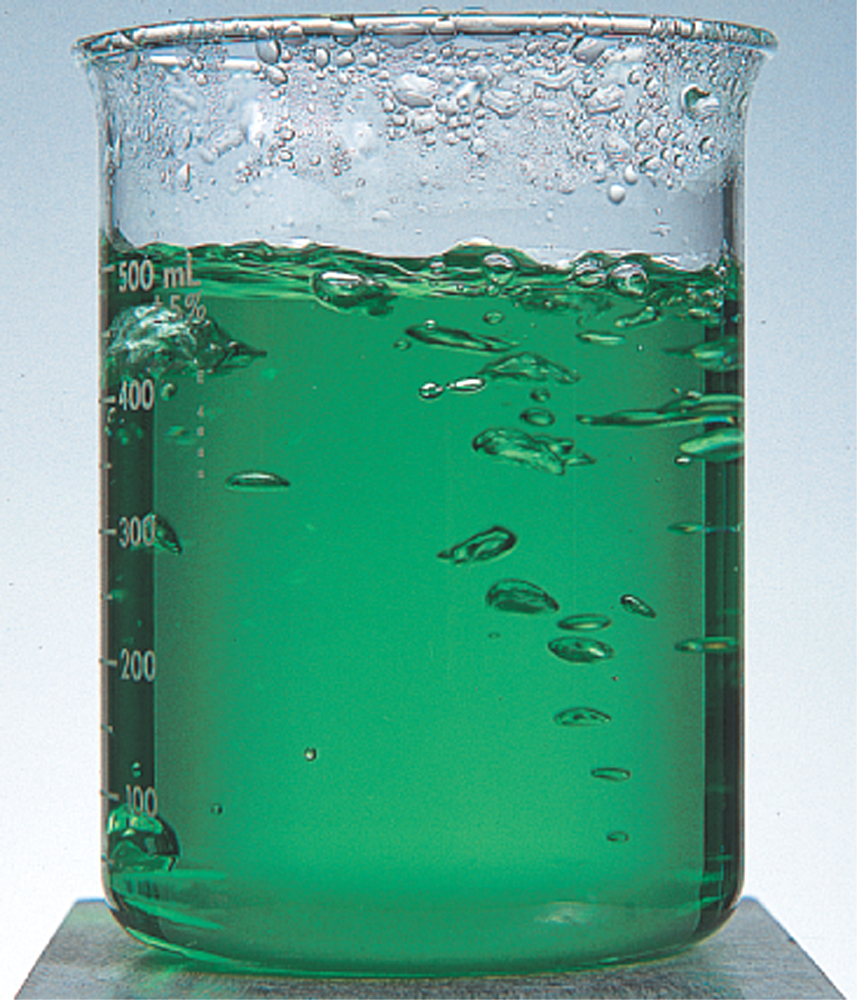
- Fig. 7.18
- Bubbles of vapor form within a liquid when the temperature of the
liquid reaches the liquid’s boiling point.
|
|
25
|
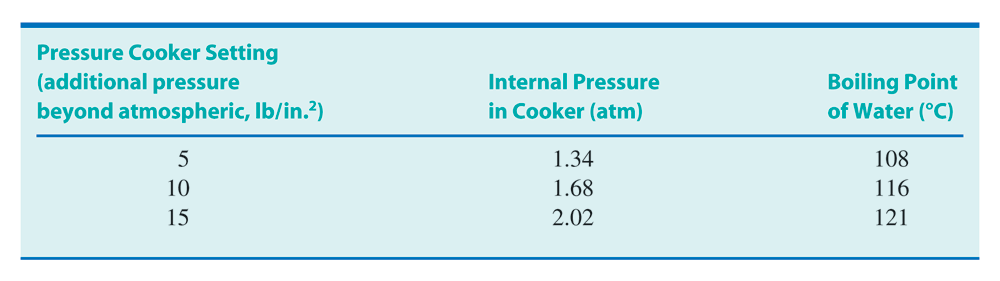
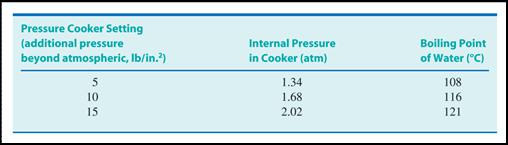
- Fig. 7.19
- The converse of the pressure cooker “phenomenon” is that food cooks
more slowly at reduced pressure.
|
|
26
|
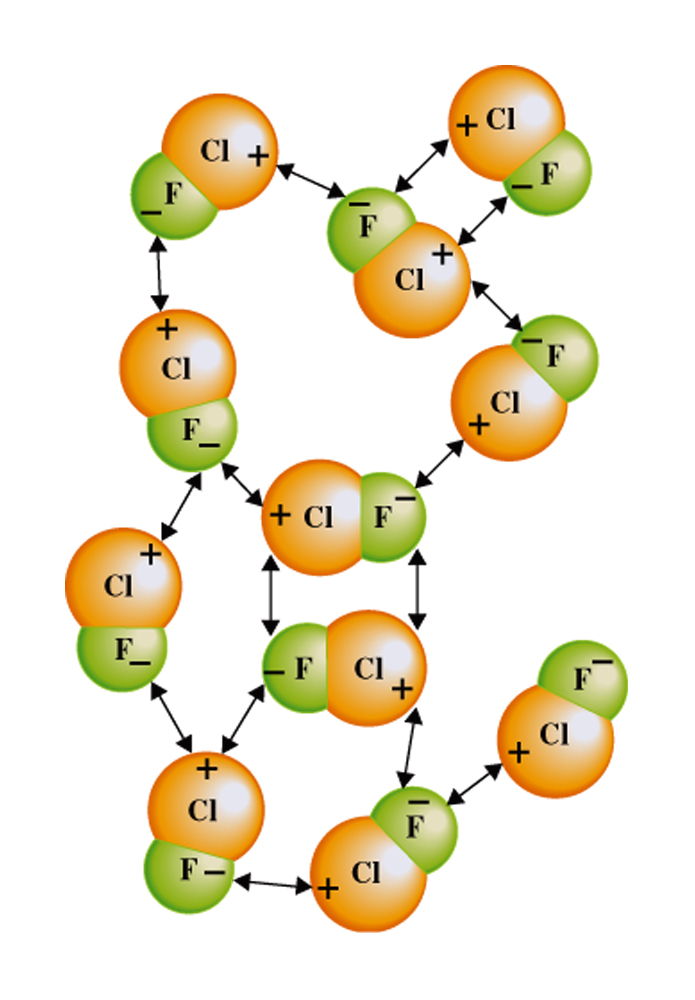
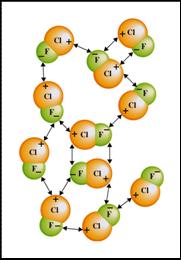
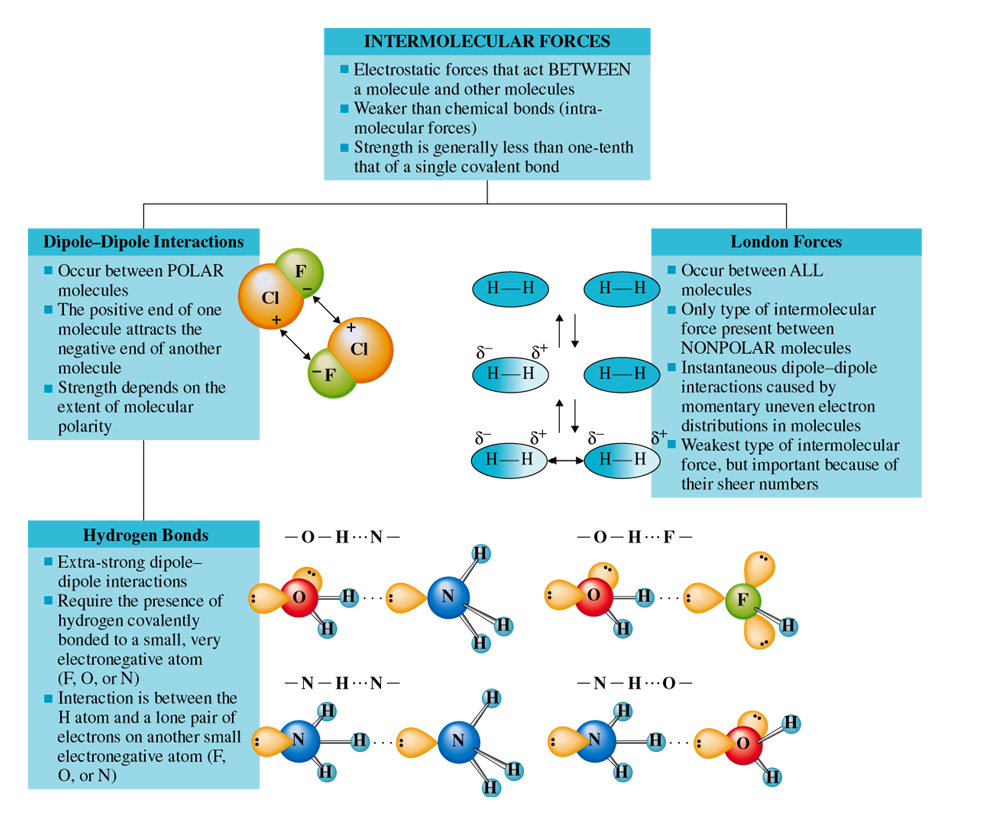
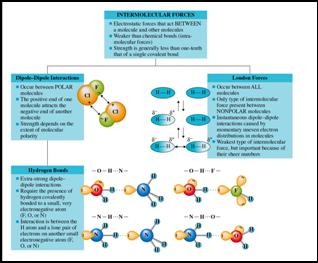
- Fig. 7.20
- There are many dipole-dipole interactions possible between randomly
arranged CIF molecules.
|
|
27
|
|
|
28
|
|
|
29
|
|
|
30
|
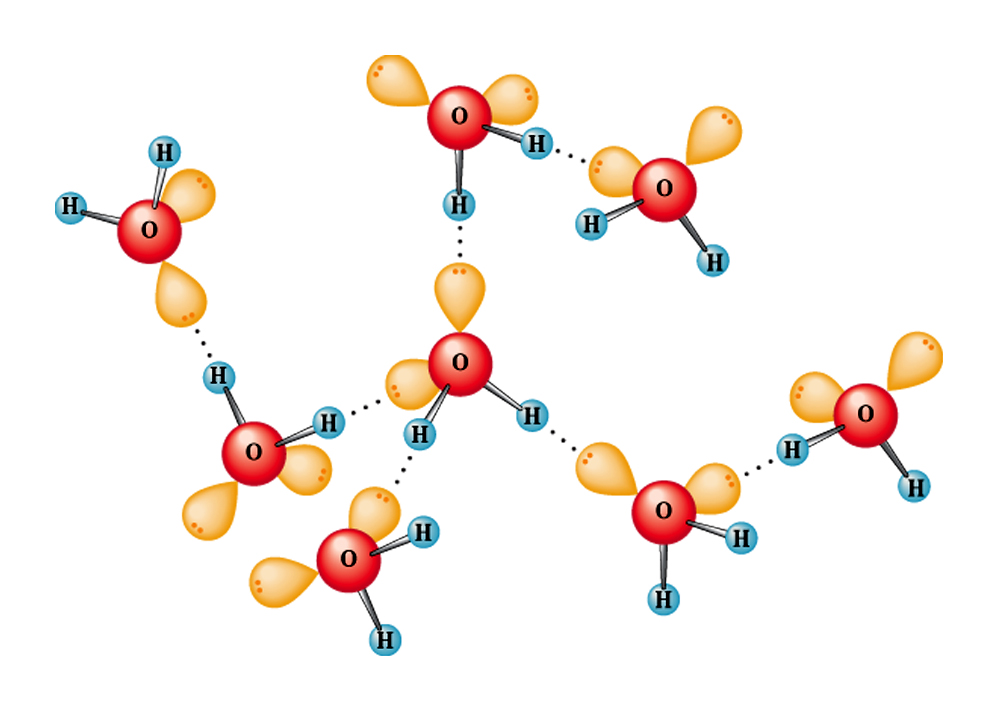
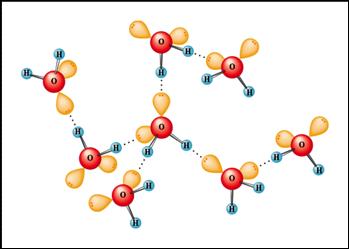
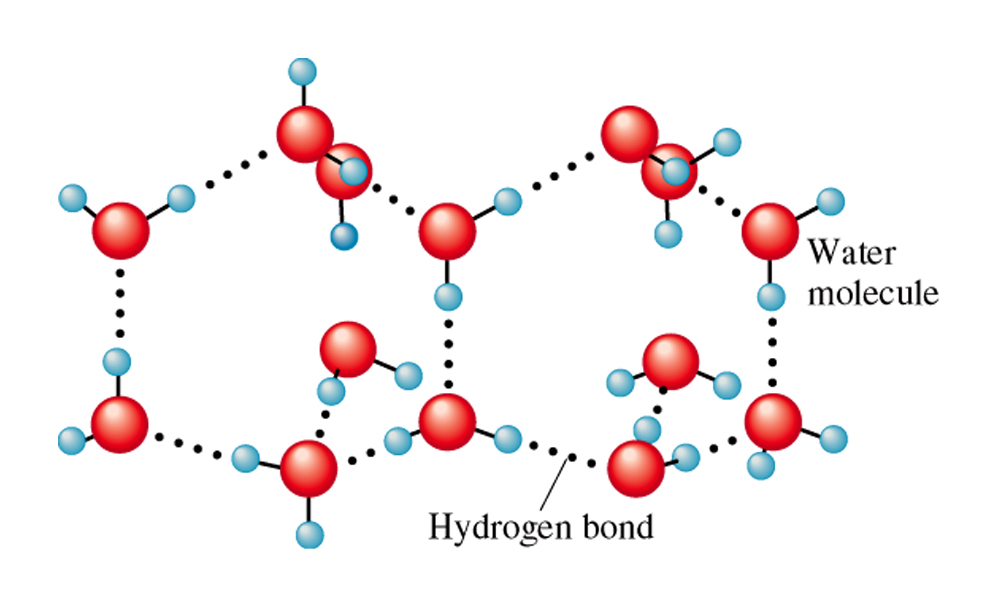
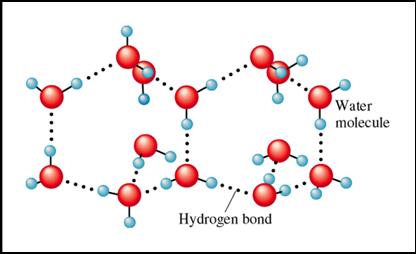
- Fig. 7.21
- Depiction of hydrogen bonding among the water molecules.
|
|
31
|
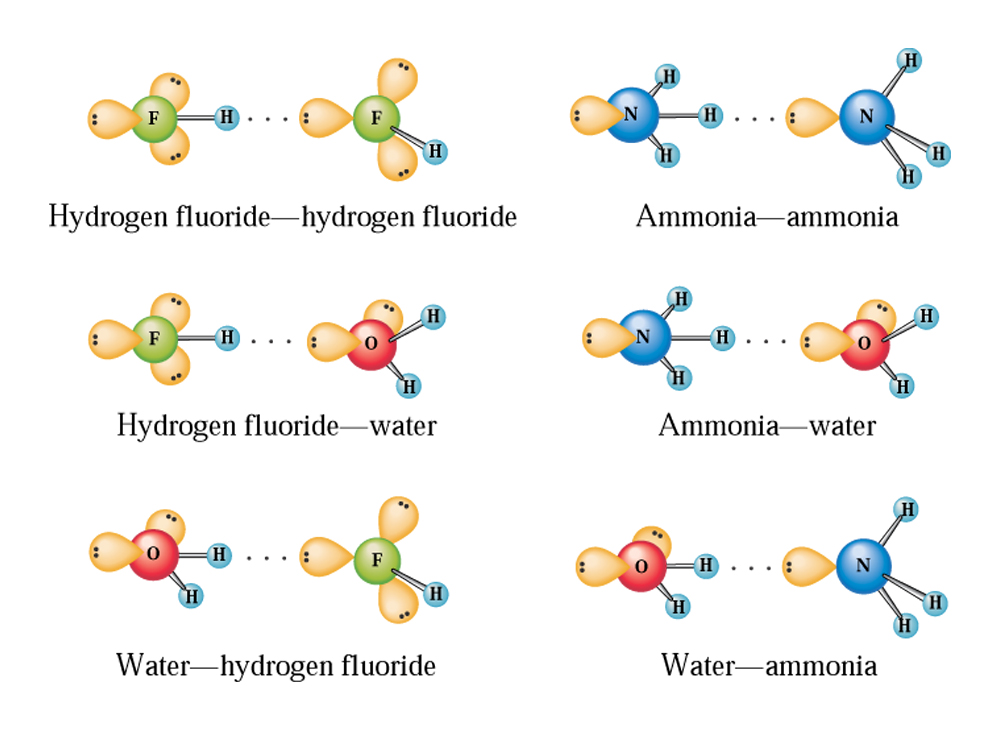
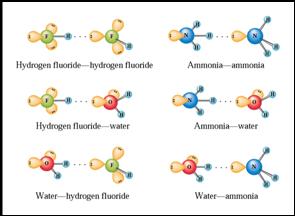
- Fig. 7.22
- Diagrams of hydrogen bonding involving selected simple molecules.
|
|
32
|
|
|
33
|
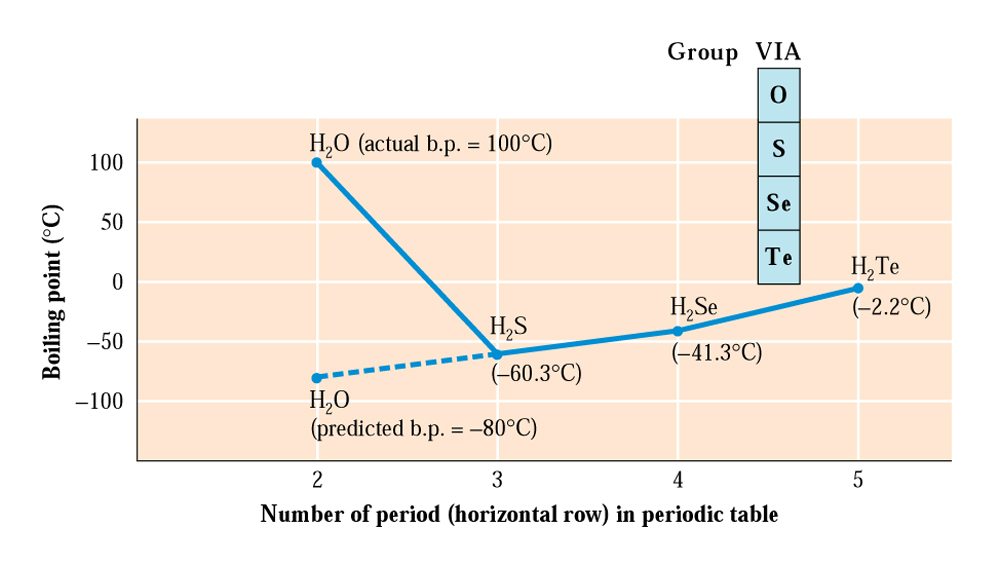
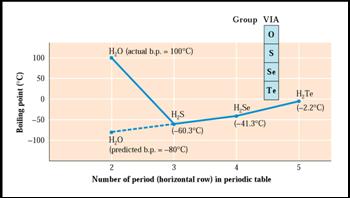
- Fig. 7.23
- If there were no hydrogen bonding between water molecules, the boiling
point of water would be approximately
-80C.
|
|
34
|
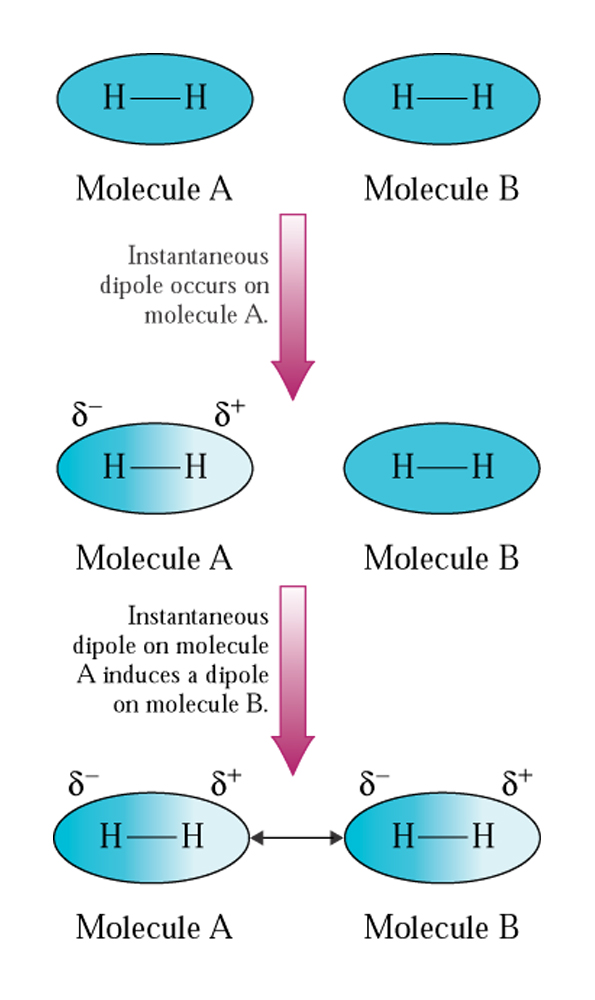
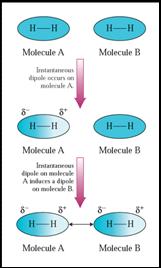
- Fig. 7.24
- Nonpolar molecules can develop instantaneous dipoles and induced
dipoles.
|
|
35
|
|

 Notes
Notes