|
1
|
|
|
2
|
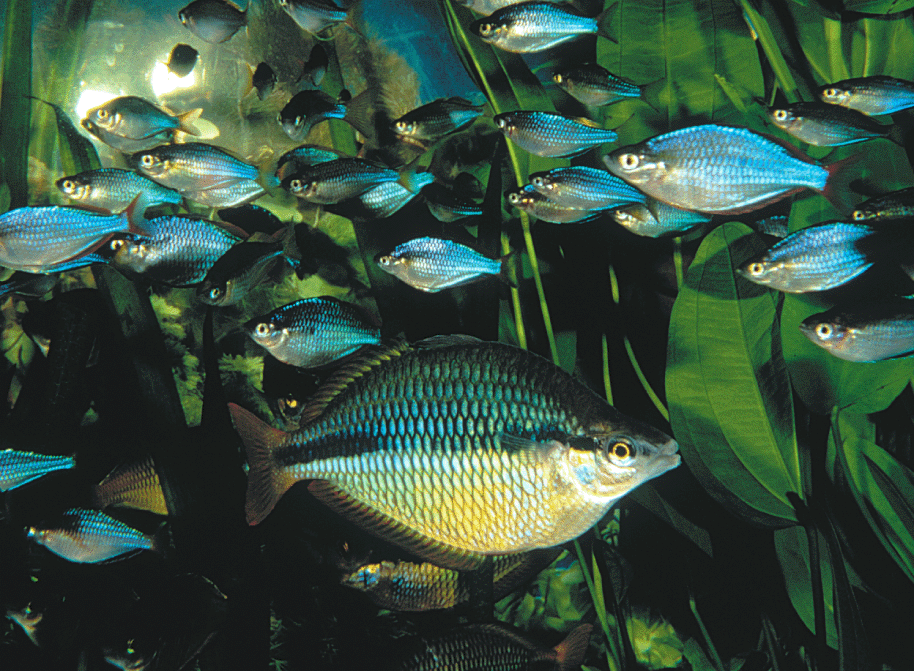
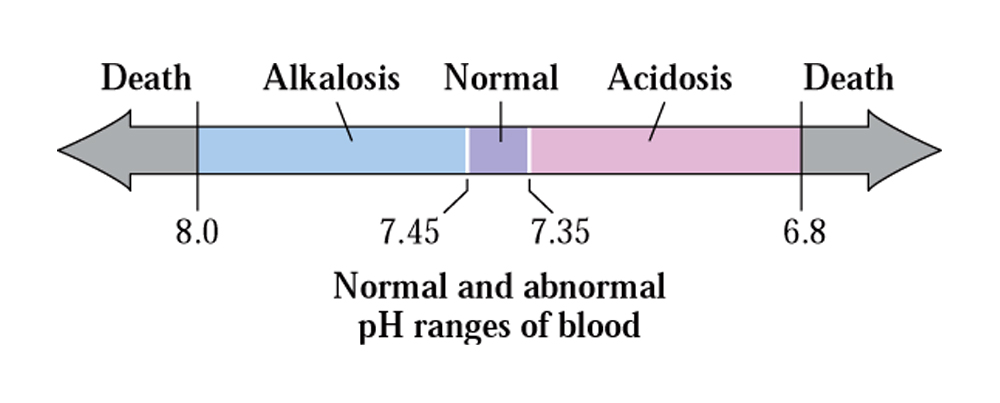
- CO 10.1
- Fish are very sensitive to the acidity of the water present in an
aquarium.
|
|
3
|
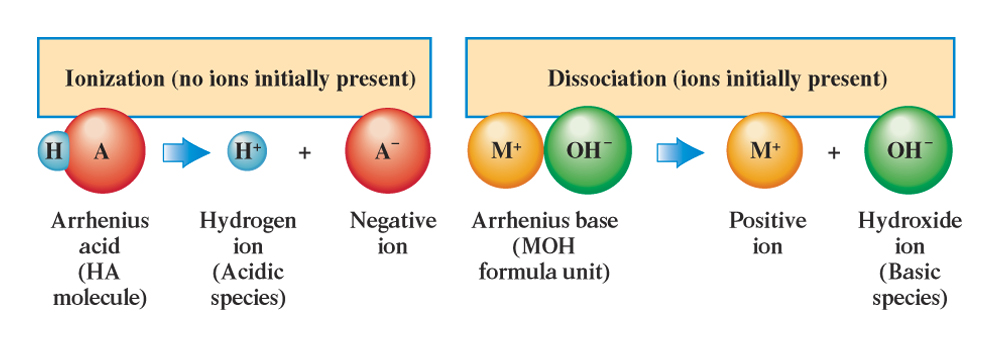
- Fig. 10.1
- The difference between the aqueous solution processes of ionization and
dissociation.
|
|
4
|
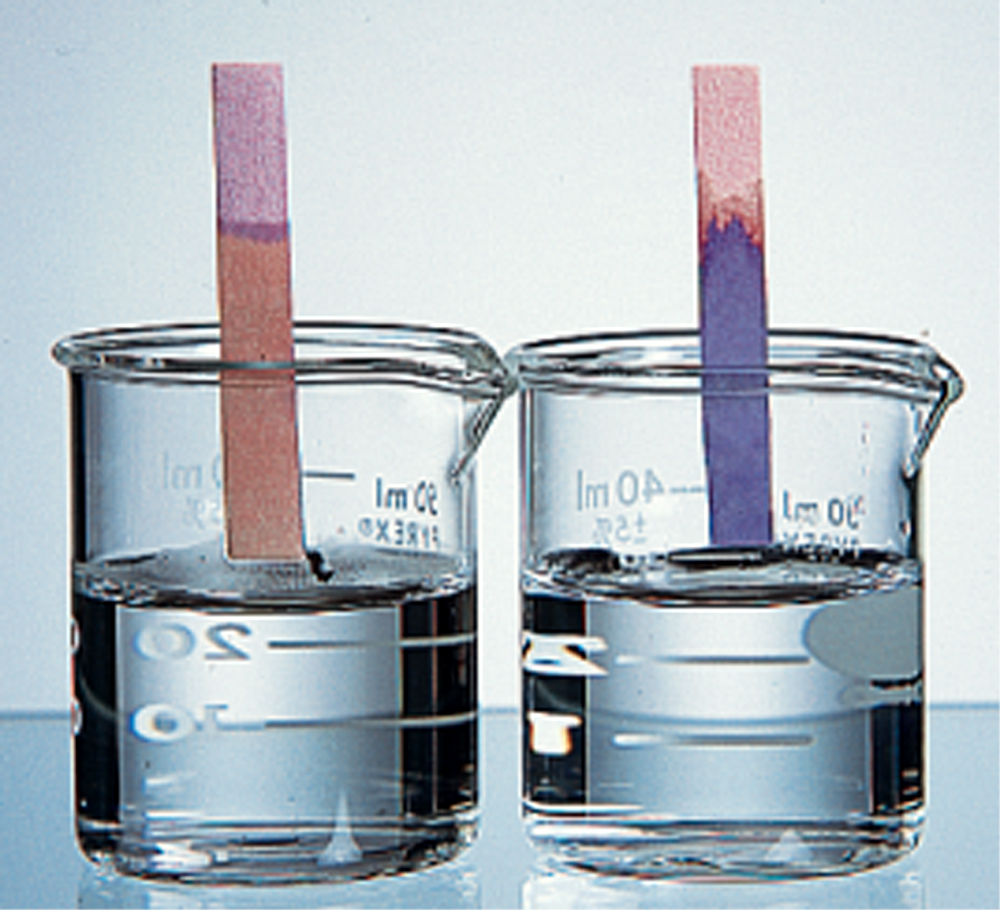
- Fig. 10.2
- Litmus is a vegetable dye obtained from certain lichens found
principally in the Netherlands.
|
|
5
|
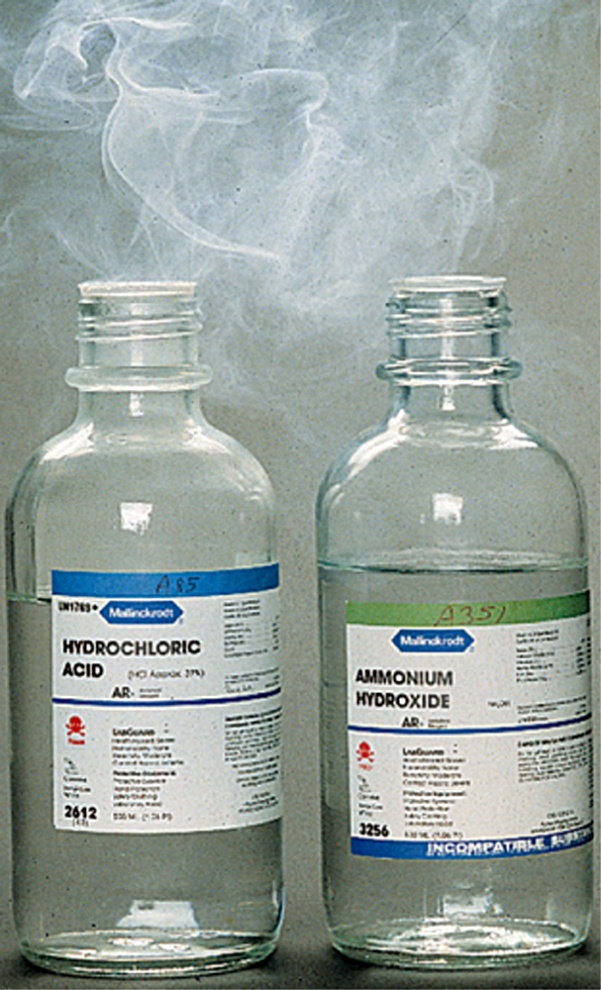
- Fig. 10.3
- A white cloud of finely divided solid NH4Cl is produced by
the acid-base reaction that results when the colorless gases HCl and NH3
mix.
|
|
6
|
|
|
7
|
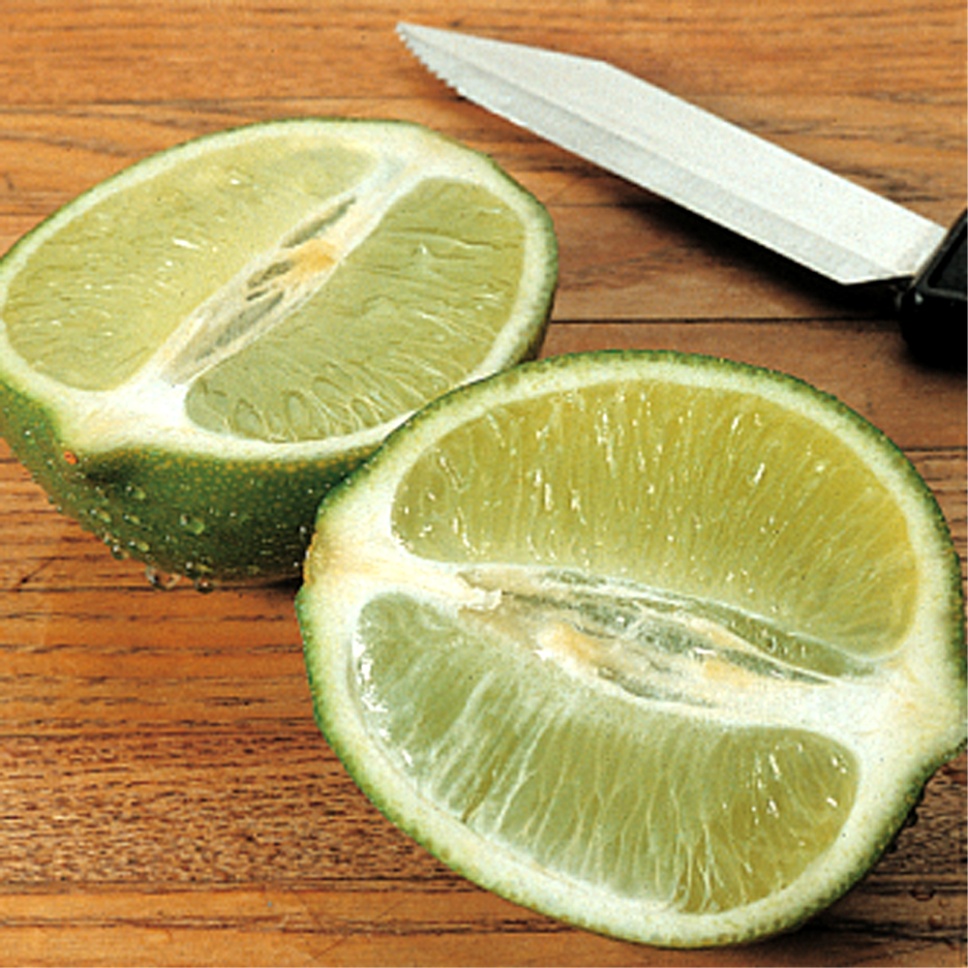
- Fig. 10.4
- The sour taste of limes and other citrus fruit is due to the citric
acid present in the fruit juice.
|
|
8
|
|
|
9
|
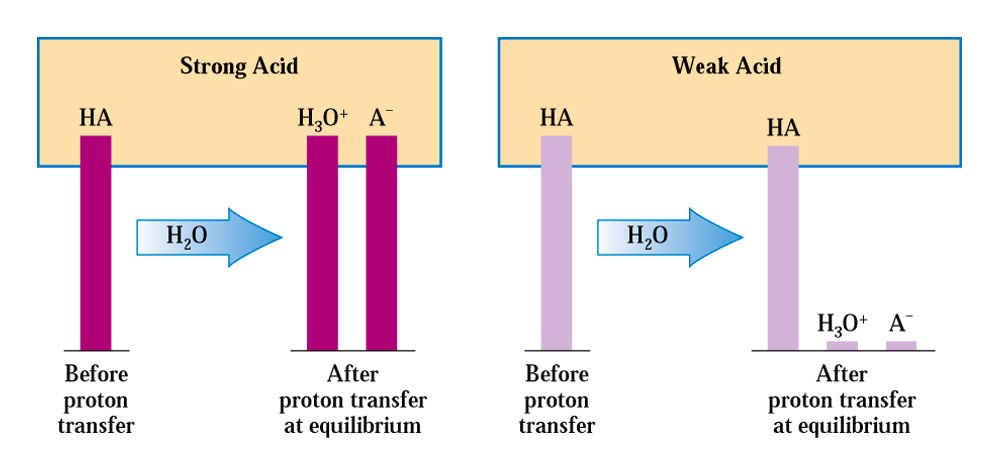
- Fig. 10.5
- A comparison of the number of acidic species present in strong acid and
weak acid solutions of the same concentration.
|
|
10
|
|
|
11
|
|
|
12
|
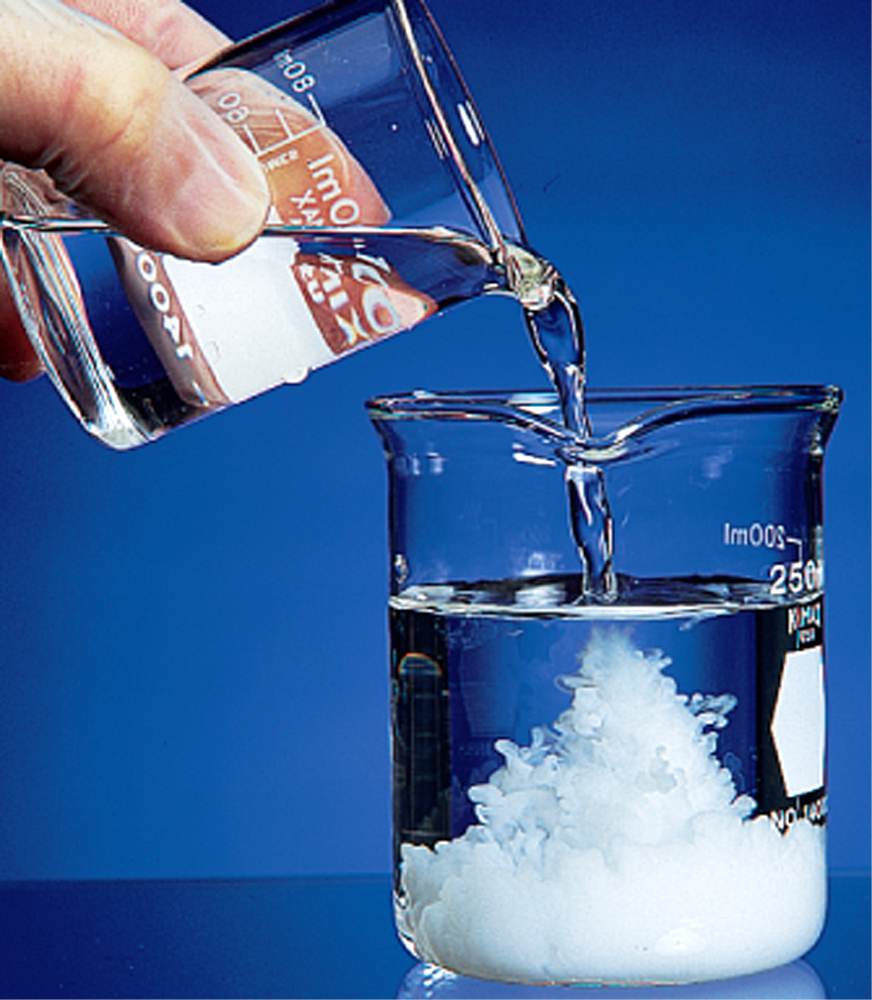
- Fig. 10.6
- The acid-base reaction between sulfuric acid and barium hydroxide
produces the insoluble salt barium sulfate.
|
|
13
|
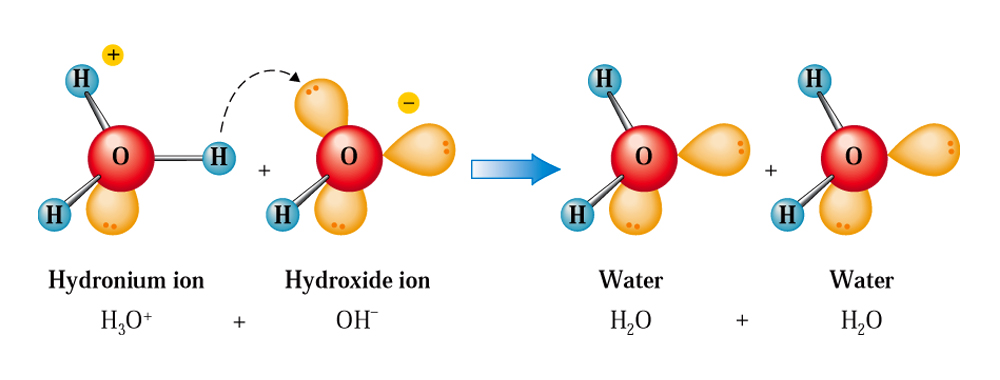
- Fig. 10.7
- Formation of water by the transfer of protons from H3O+ ion
to OH- ions.
|
|
14
|
|
|
15
|
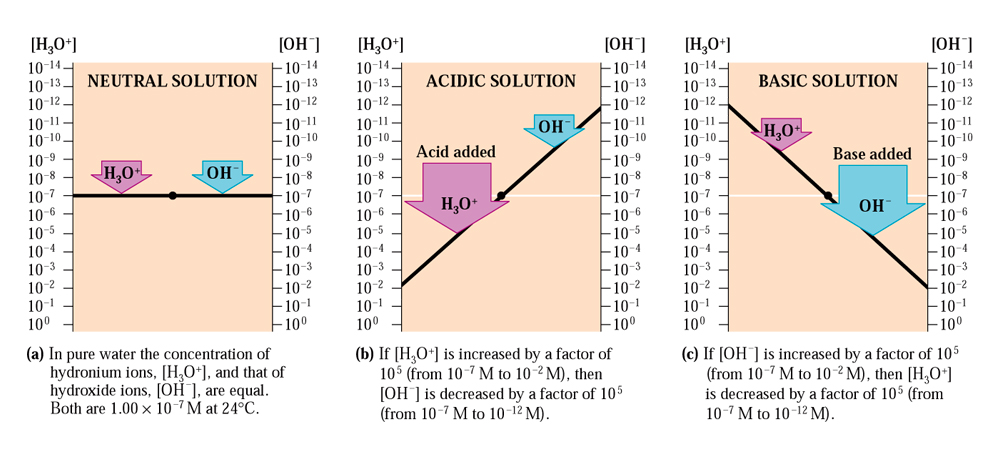
- Fig. 10.9
- The relationship between H3O+ and OH- in aqueous solution is
an inverse proportion.
|
|
16
|
|
|
17
|
- Fig. 10.10
- Most fruits and vegetable are acidic.
|
|
18
|
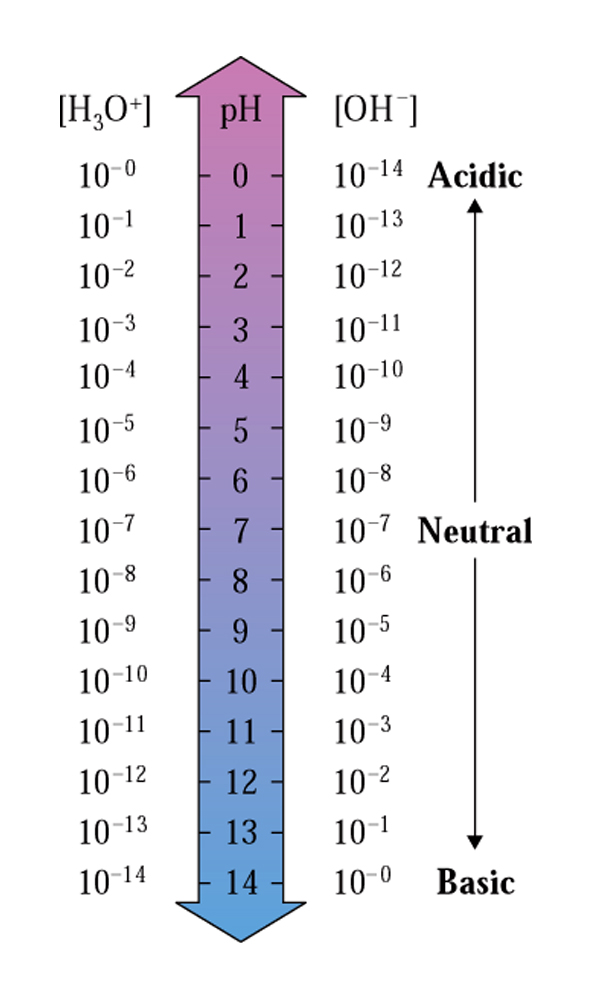
- Fig. 10.11
- Relationship among pH values, H3O+ and OH- at 24 degrees
Celsius .
|
|
19
|
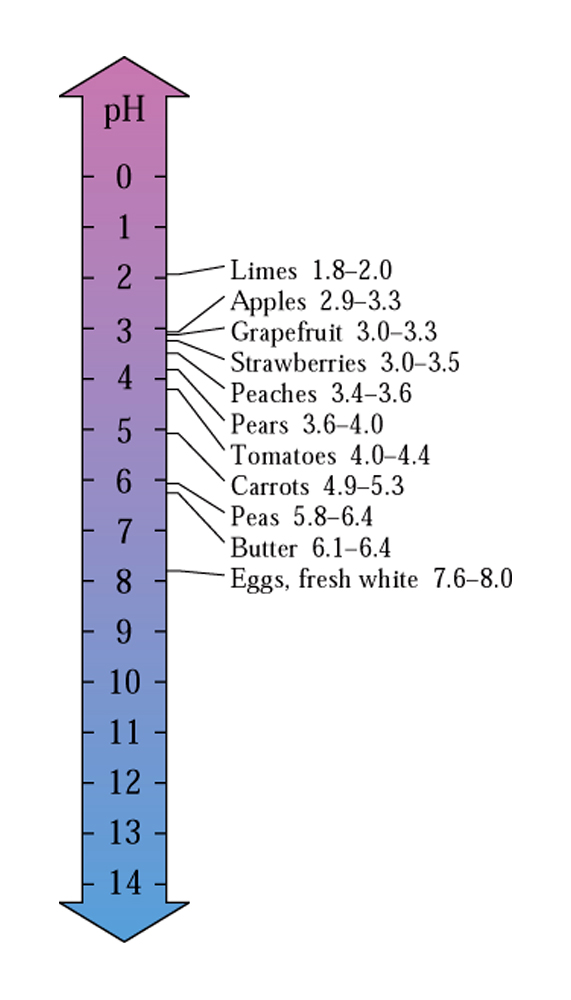
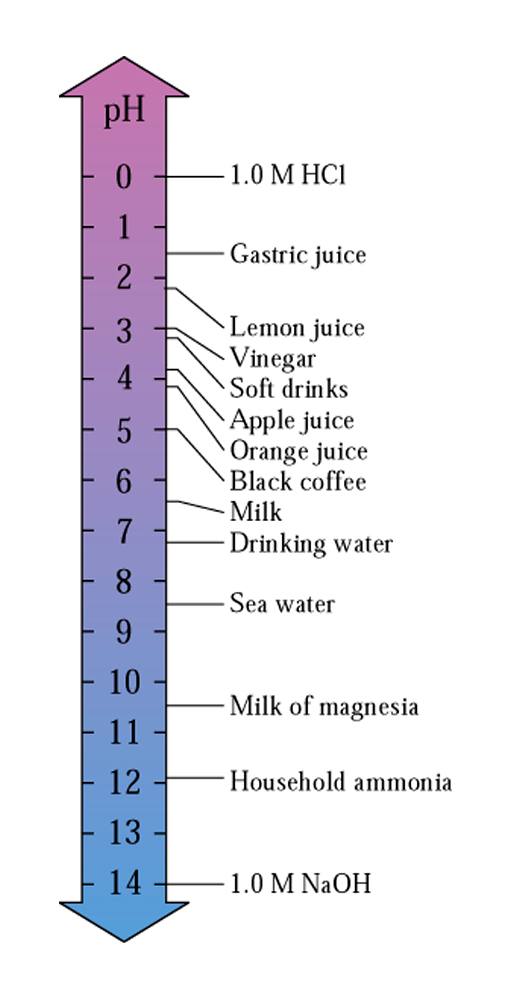
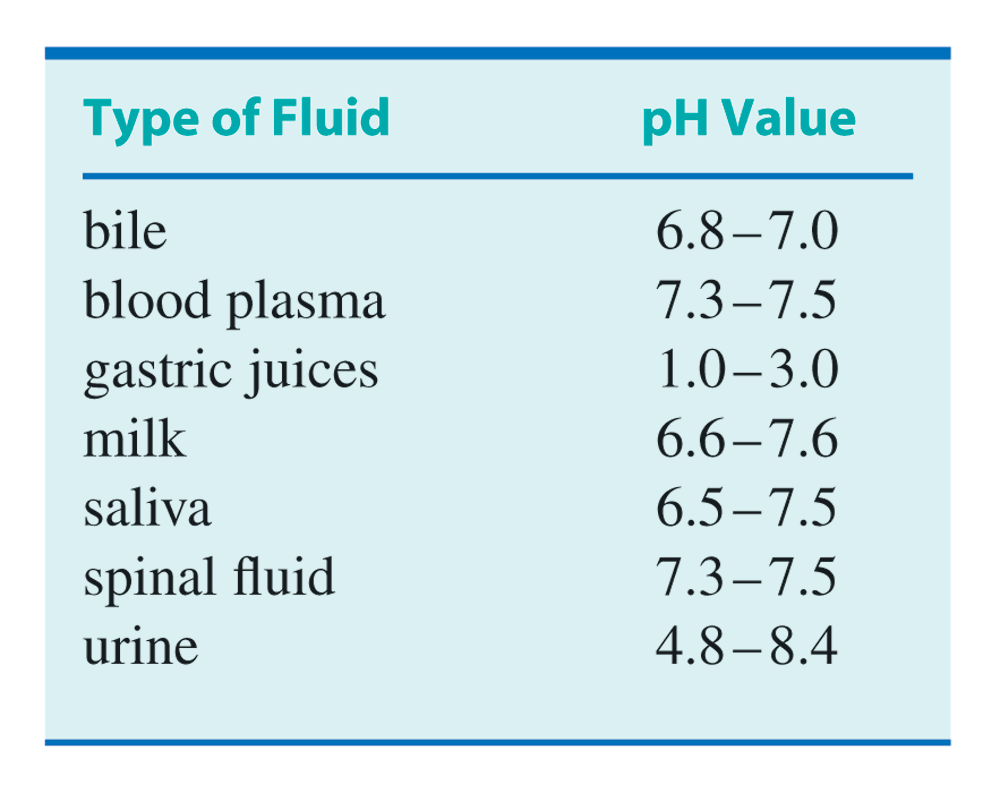
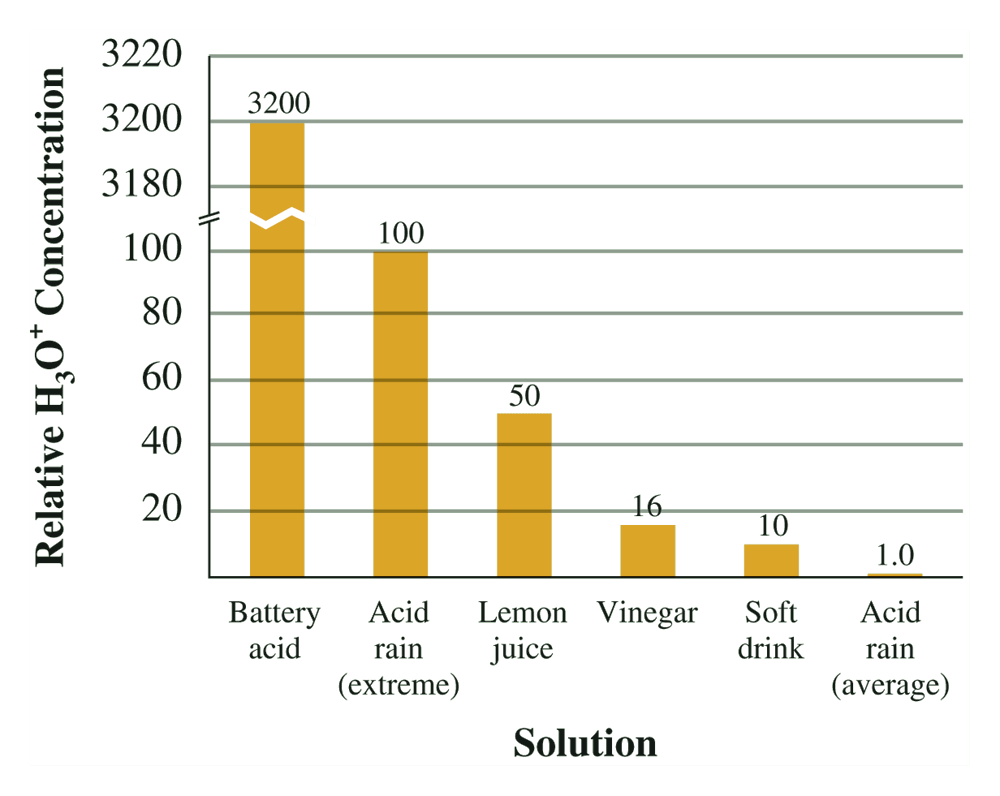
- Fig. 10.12
- pH values of selected common liquids.
|
|
20
|
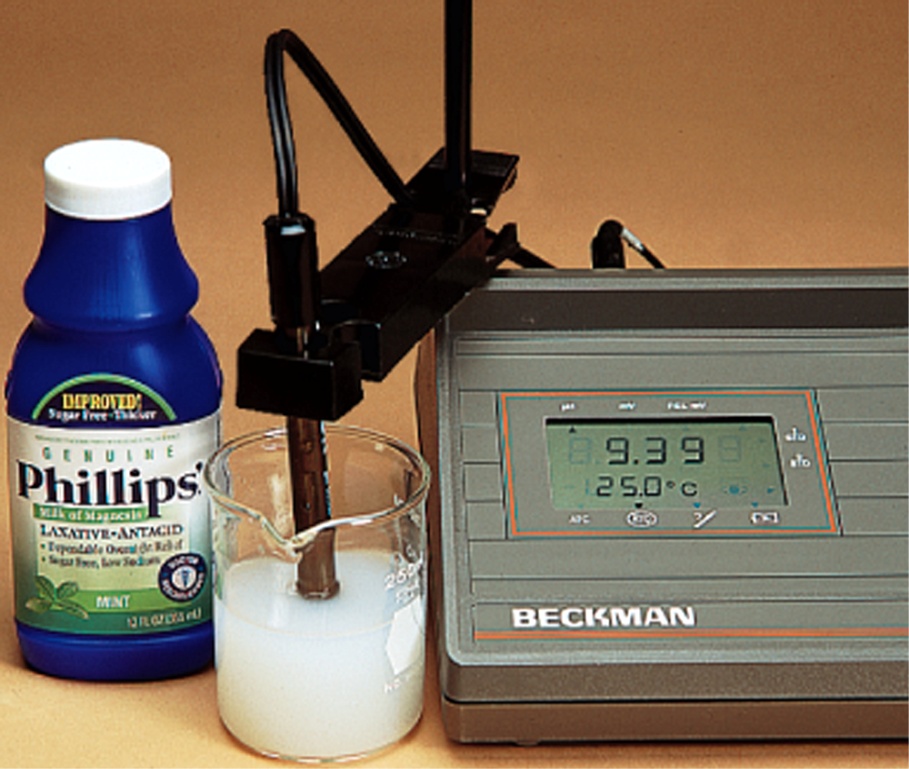
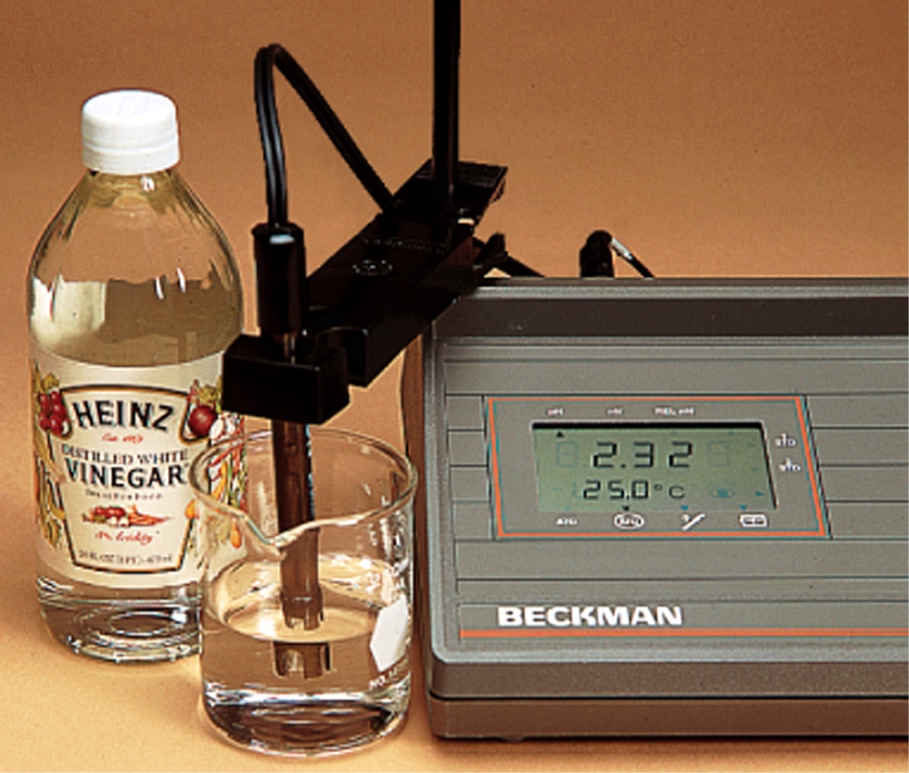
- Fig. 10.13
- A pH meter gives an accurate measurement of pH values.
|
|
21
|
|
|
22
|
|
|
23
|
|
|
24
|
|
|
25
|
|
|
26
|
|
|
27
|
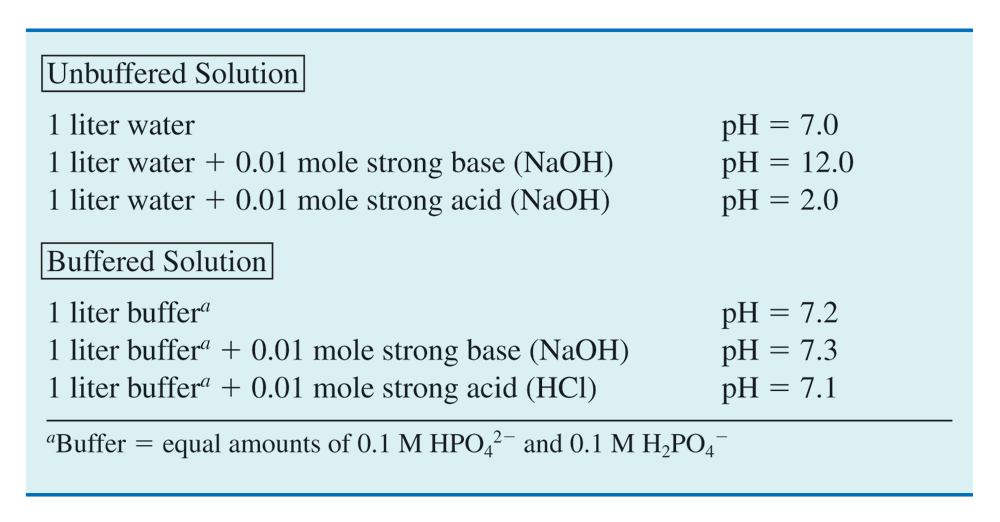
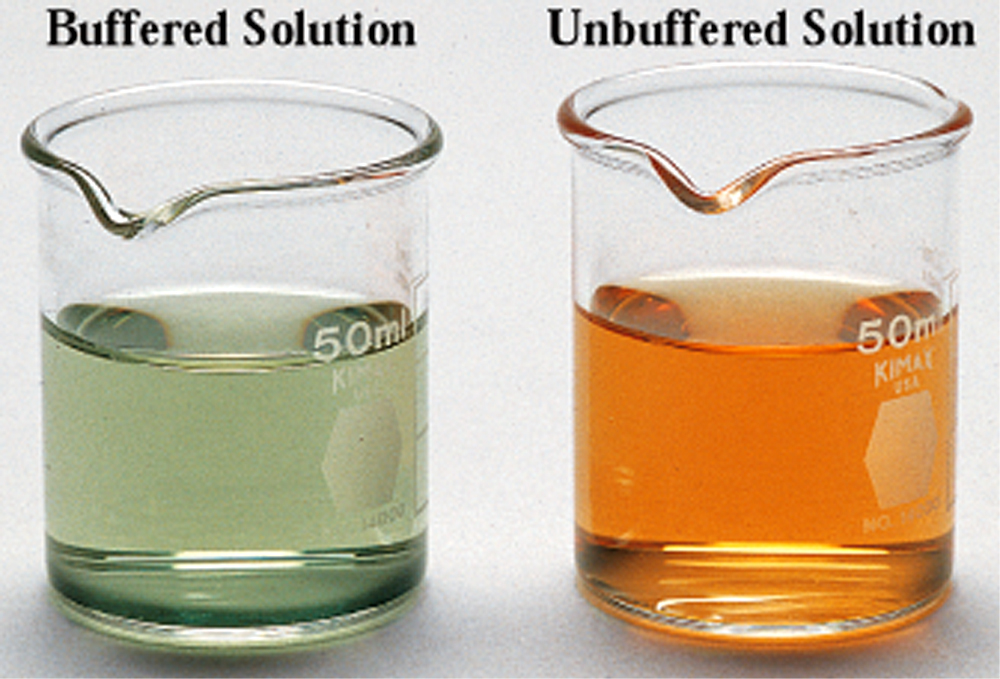
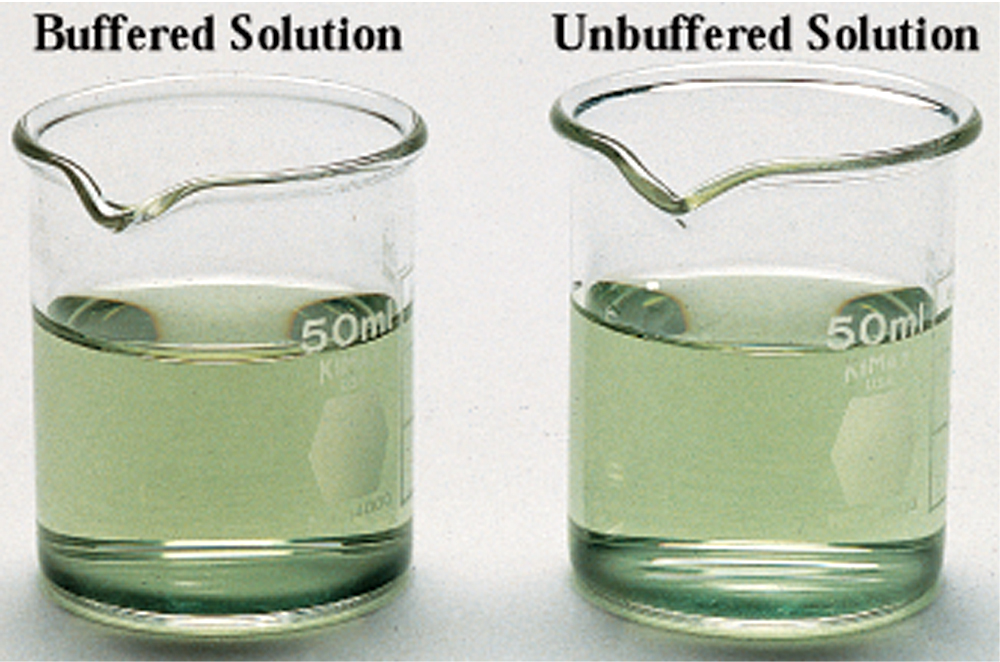
- Fig. 10.14 (a) The
buffered and unbuffered solutions have the same pH level.
|
|
28
|
|
|
29
|
|
|
30
|
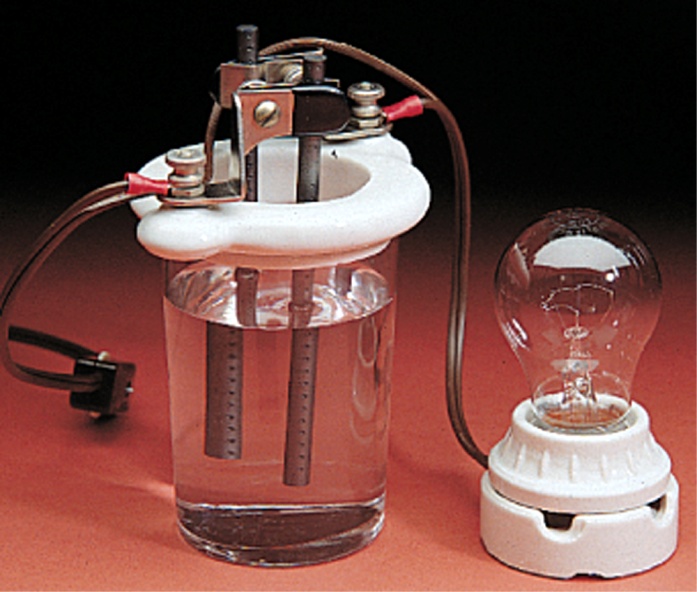
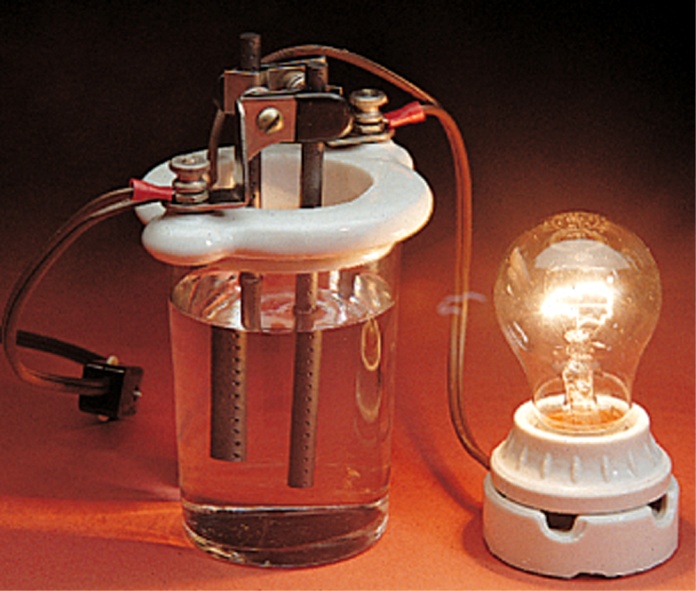
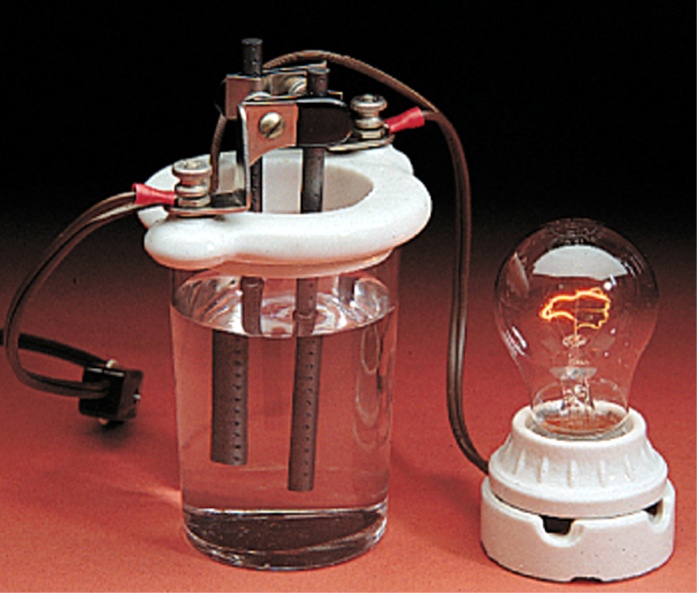
- Fig. 10.15
- This simple device can be used to distinguish among strong
electrolytes, weak electrolytes, and nonelectrolytes.
|
|
31
|
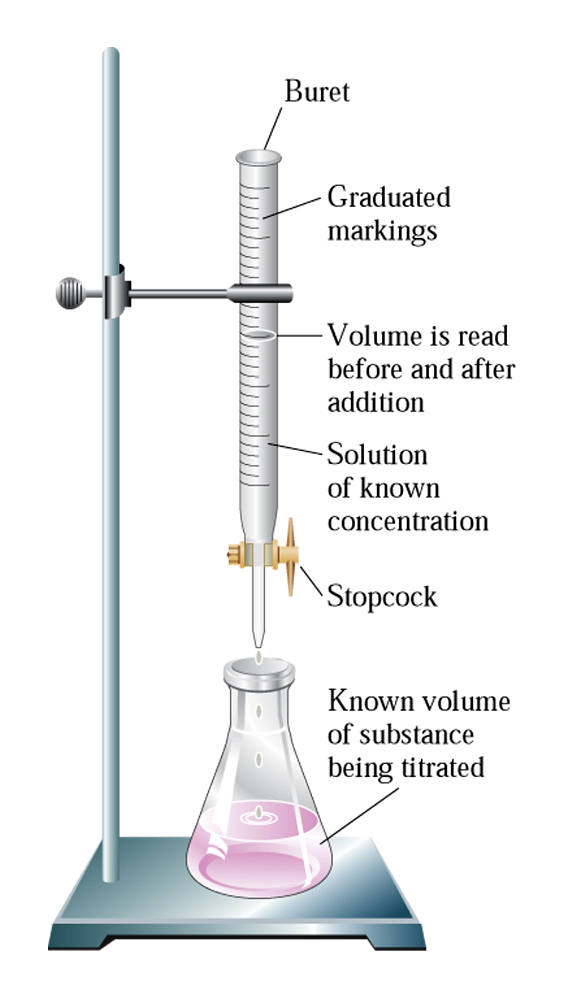
- Fig. 10.16
- Diagram showing setup for titration procedures.
|
|
32
|
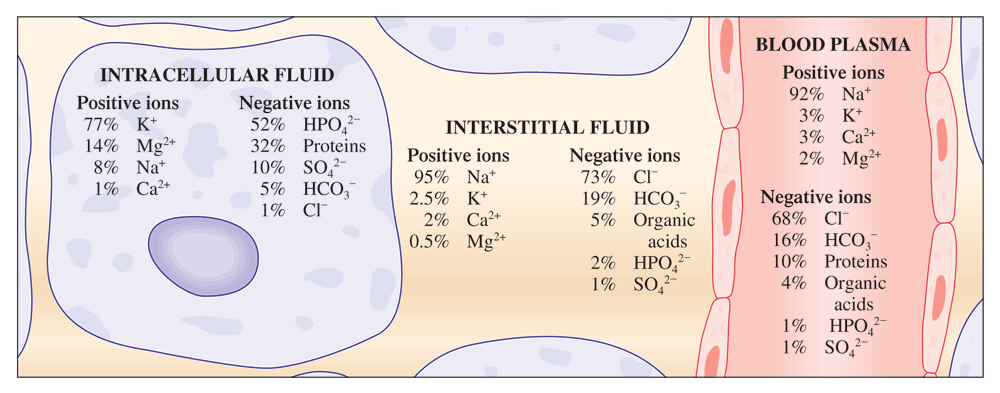
- CC 10.5
- Electrolyte and Body Fluids
|
|
33
|
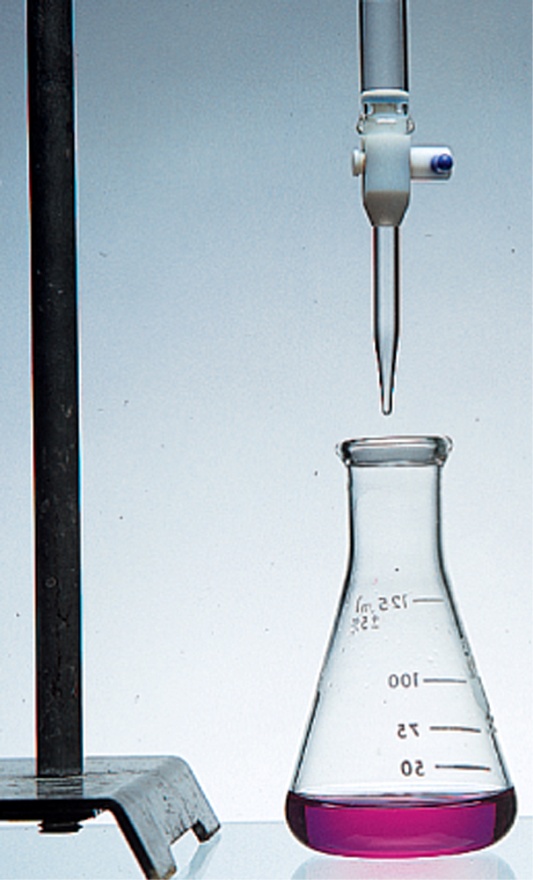
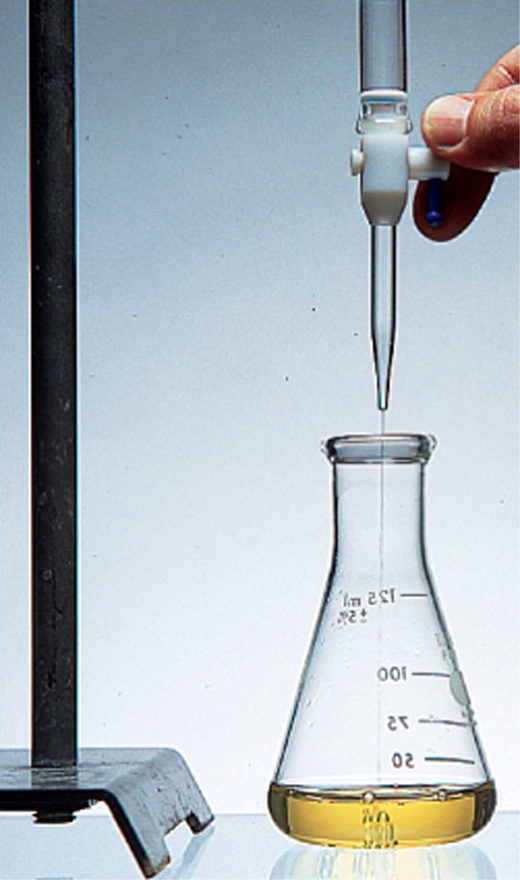
- Fig. 10.17
- An acid-base titration using an indicator that is yellow in acidic
solution and red in basic solution.
|

 Notes
Notes