Background Information
The temperature at which a solution freezes will be lower
than the temperature at which the pure solvent freezes. The difference
between the freezing point of a solvent (T°f)
and the freezing point of the solution (Tf) is referred
to as the freezing point depression (DT).
A solutions freezing point is related to the molality (m) of the
solution. The equation that describes the relationship between freezing
point depression and molality is:
DTf
=
(Kf)(m)
DT represents the freezing
point depression: DT
= Tf°- Tf
Tf°
is the freezing point of the pure solvent.
Tf is the freezing point of the solution.
Kf is the molal freezing point depression
constant.
The value of Kf is characteristic for a given solvent.
The units of Kf are given in °C/m.
m is the molality of the solution. m
= moles of solute/ kg of solvent.
| Example
A solution made from 0.840 g of a substance dissolved in 25.0 g of camphor froze at 170.80oC. The freezing point of pure camphor is 178.40oC and the molal freezing point depression constant, Kf , for camphor is 37.7°C/m. Calculate the molecular weight of the solute. DT = Tf°- Tf = 178.40oC 170.80oC = 7.60oC DTf = (Kf)(m) = [(Kf)(g solute)] / [(MW)(kg solvent)] 7.60oC = [(37.7oC/m )( 0.840 g solute)] / [(MW)(0.025 kg solvent)] MW = 167 g/mol |
In this experiment, the molecular weight of sucrose (C12H22O11) will be determined from measurements made on the freezing point of pure water (Tf°), the freezing point of an aqueous solution of sucrose (Tf), and the weight of sucrose and water in the solution.
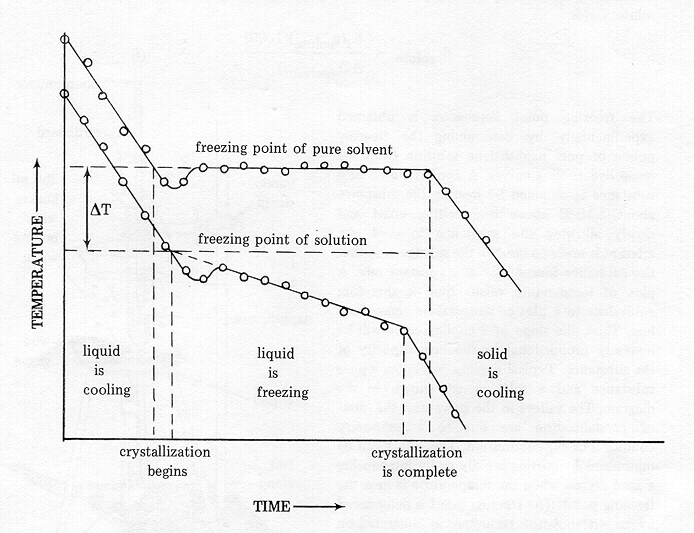
The freezing point of pure water is determined by cooling
a sample of water and measuring its temperature as a function of time.
The resulting data are used to construct a cooling curve. A cooling
curve is a plot of temperature (y-axis) vs. time (x-axis) (See Figure 1.).
The freezing point of the solution is determined in the same way as the
freezing point of the solvent. The cooling curve, however, has a
different appearance and is shown in Figure 1.
Figure 1.
Put on your CHEMICAL SPLASH-PROOF SAFETY GOGGLES!
Experimental Procedures
Part A. Preparation of an Ice Bath
Fill a 600 mL or 800 mL beaker approximately ¾
full with ice and cover the ice with 3-4 cm of rock salt. Stir this
ice-salt mixture with a scoopula and make sure the temperature drops to
-5 °C to -10 °C. This ice bath will be used in each experiment.
Be sure to check the temperature of the ice bath before each experiment.
If the temperature has risen above -10°C, then drain the water and
add more ice and salt.
Part B. Determination of the Freezing Point of
Water
1. Add about 25 mL of deionized water
to a 25 x 200 mm test tube.
2. Insert a wire stirrer and thermometer into the test tube. NOTE: A two-hole stopper is used to hold the stirrer and thermometer. The thermometer should be inserted into the stopper hole that is split. The bulb of the thermometer must be below the liquid level inside the test tube.
3. Place the test tube into the ice bath and clamp the test tube to a ring stand so that the liquid level in the test tube is below the ice.
4. Stir the liquid inside the test tube continuously at a uniform rate with the wire stirrer and take temperature and time readings at 30-second intervals. Record the thermometer reading to within 0.5oC.
5. Continue taking measurements until 6 successive temperature readings are equal to one another. All of the liquid inside the test tube may not freeze solid. Immediately remove the test tube from the ice bath once the readings are complete.
6. Remove the test tube and allow the water to melt and then repeat the freezing of the water (steps 3-5) for a second data set. Be sure to check the temperature of the ice bath before performing the second trial. Make sure that the thermometer is clean before inserting back into the liquid in the test tube.
Part C. Determination of the Freezing Point of
an Aqueous Sucrose Solution
1. Using a clean dry 25 x 200 mm test
tube, prepare a solution of sucrose (C12H22O11)
and water by dissolving about 11 g of sucrose in about 25 g (25 mL) of
water. NOTE: Precise measurements of the mass of the sucrose and
mass of water are essential. Record the mass of each to +0.01
g.
2. Measure the freezing point of the sucrose solution using the procedures from steps 3-5 in part B.
3. Discard the sucrose solution down the drain, obtain a clean dry 25 x 200 mm test tube and repeat steps 1 and 2 for a second data set. Be sure to check the temperature of the ice bath before performing the second trial. Make sure that the thermometer is clean before inserting back into the liquid in the test tube.
Part D. Calculations
1. Plot graphs of temperature (y-axis)
vs. time (x-axis) for the data sets from each of the trials in Part B and
Part C.
2. Determine the respective freezing point from each graph.
3. Calculate an average value of the freezing point of the pure water from the graphed results of the two trials in Part B.
4. Calculate experimental molecular
weight values for sucrose from the freezing point depressions of the two
trials in Part C.
NOTE: The molal
freezing point depression constant, Kf , for water is 1.86°C/m.
5. Calculate a percent error for each
of the molecular weight values.
Chemistry 104: Molecular Weight by Freezing Point Depression
Name________________________________________Hood No.______ Date_____________
Put on your CHEMICAL SPLASH-PROOF SAFETY GOGGLES!
Show all calculations on an attached second sheet.
Part B. Determination of the Freezing Point of Water
| Freezing point of water from graph | Trial #1 __________oC | Trial #2 __________oC | Average _________oC |
Part C. Determination of the Freezing Point of an Aqueous
Sucrose Solution
| Trial #1 | Trial #2 | |
| Mass of sucrose (C12H22O11) | __________g | __________g |
| Mass of water (g) | __________g | ___________g |
| Mass of water (kg) | ___________kg | ___________kg |
| Freezing point of solution from graph | __________oC | ___________oC |
| Freezing point depression | __________oC | ___________oC |
| Experimental molecular weight from freezing point depression data |
__________g/mol |
__________g/mol |
| Percent error | ________% | ________% |