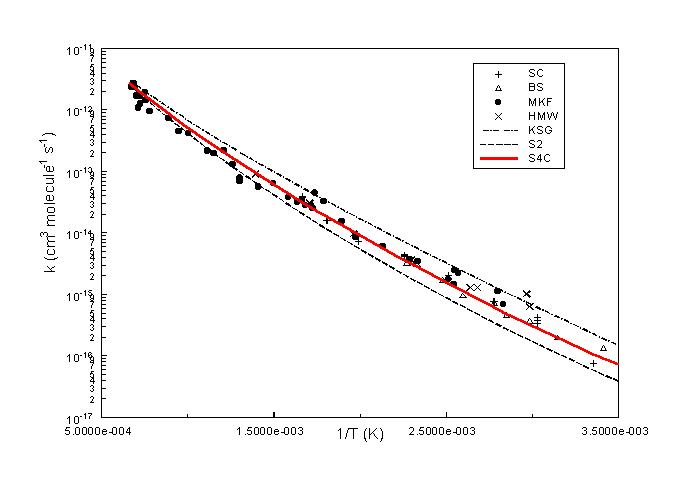
Comparison of VTST rate coeffts. calculated using POLYRATE 8.0 on KSG, RSW S2, and S4C potential surfaces with available experimental data.
Last modified: February 19, 1999
PDF Version:
Text
(148 K)
Figure
1 (122 K)
Figure
2 (54 K)
Figure
3 (45 K)
Figure
4 (27 K)
Figure
5 (25 K)
Figure
6 (27 K)
Figure
7 (87 K)
PostScript Version:
Text
(3.62 Mb)
Figure
1 (353 K)
Figure
2 (228 K)
Figure
3 (164 K)
Figure
4 (103 K)
Figure
5 (91 K)
Figure
6 (99 K)
Figure
7 (302 K)
Version Date: April 7, 1999
Just in case you are interested:
Comparison of VTST rate coeffts. calculated using POLYRATE 8.0 on KSG,
RSW S2, and S4C potential surfaces with available experimental data.
Last modified: February 19, 1999
A PDF
version and a PS
version of this figure are available for downloading and printing.
To download, hold down the SHIFT key and click on the link.